By John Pfeifer
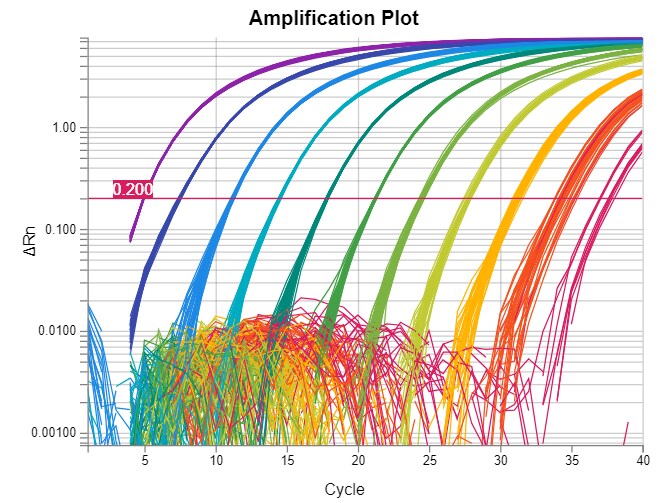
Real-time PCR (polymerase chain reaction) is a technology that detects amplification of a specific genetic sequence after each PCR cycle. This technology can detect or quantify gene sequences for a wide variety of applications.
A real-time PCR assay includes a combination of oligonucleotides designed to amplify and detect a specific gene target. Real-time PCR assays often consist of two PCR primers and a fluorescently labeled probe, called the TaqMan probe.
Real-time PCR tests or experiments are usually programmed to run 40 cycles, but high-value data span only a few cycles and those cycles can differ sample to sample. How can high-value data points be selected from real-time PCR data?
Amplification Plot
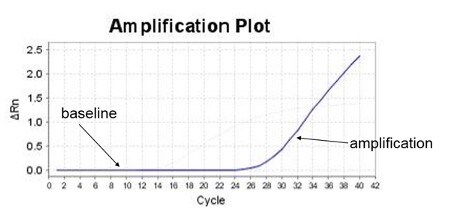
Real-time PCR data are often represented in a graph called an amplification plot (Figure 1). The vertical axis is in fluorescent units, and the measurement is often called ΔRn, which is a baseline subtracted normalized reporter. The horizontal axis is in PCR cycle numbers.
Baseline is defined as data from the early PCR cycles before amplification signal becomes detectable. In an amplification plot with a linear vertical axis scale, the baseline should appear as a flat line. During the baseline cycles, target gene amplification may have been happening, but growing reporter signal (e.g., from TaqMan probes) has not accumulated sufficiently to be visible. If target is present in the reaction, eventually amplification signal will emerge from the baseline.
Figure 1
Gene Quantification
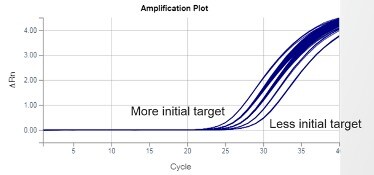
Real-time PCR is the gold standard for gene quantification. The reason is the remarkable consistency of exponential-phase amplification. Exponential (a.k.a., geometric, logarithmic) is the first phase of PCR, in which all the reactants—such as primers, DNA polymerase, dNTPs, etc.—are in excess, fueling consistent efficiency. This consistency means the initial target gene quantity in the PCR reaction will determine when amplification signal emerges from the baseline, as illustrated in Figure 2. The greater the starting target quantity, the earlier the amplification signal will emerge.
Figure 2
One high-value data point is needed from each amplification plot to calculate initial target quantity values. Baseline data points have no quantitative value. Exponential-phase data points have the greatest value. When one of the reactants is no longer adequate to fuel consistent efficiency, exponential phase ends and subsequent data points diminish in value. A method is needed to select exponential-phase data points at a consistent point, so they are comparable within an assay.
Ct Values
Single data points derived from real-time PCR amplification plots are called threshold cycles or “Ct” (a.k.a., Cq) values. The first and still most popular method of producing Ct values is called baseline-threshold.
In all real-time PCR chemistries, some baseline fluorescence is always present, which can vary somewhat from well to well. This variation is greatly reduced by the baseline subtraction algorithm in real-time PCR software, which sets all baselines to approximately zero. By setting all baselines to zero, thresholds will be set from a consistent starting point.
Threshold is a fluorescent value (ΔRn) selected for an assay, from which Ct values will be calculated. Thresholds are usually set within the exponential phase of PCR. Exponential phases are best identified on a log scale y-axis of an amplification plot, where they appear as parallel lines with a positive slope (Figure 3). In the amplification plot, the threshold is seen as a horizontal line.
Figure 3
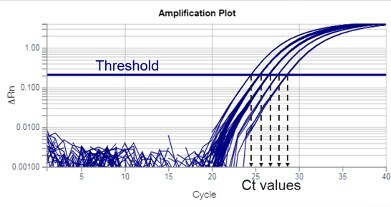
The intersection of the threshold and amplification plot produces a Ct value. Ct values are typically not whole numbers.
Qualitative Results
Ct values can be used for qualitative assays, such as determining the presence or absence of a pathogen. The absence of a Ct value means the target was not present in that reaction and the presence of a Ct value means the target was present.
Qualitative assays often include a control gene for purposes of quality control. If the control assay Ct value is too high, the validity of a target negative sample result is called into question. For example, there might have been a problem with sample collection, extraction, an inhibitor, etc., that could reduce the sensitivity of the assay below an acceptable level.
For qualitative assays, thresholds are usually fixed to maintain consistency in Ct value calculations each time the assay is run.
Quantitative Results
Quantitative results come in multiple types: relative vs. absolute, and amount vs. concentration. In real-time PCR software, the term “quantity” is used generically to encompass all these result types.
Absolute quantification with real-time PCR is determining the molecular amount or concentration of the target. Relative quantification is determining quantities with nonmolecular or arbitrary units.
Reporting Ct values as final quantitative values is not recommended, because Ct values are abstract, incomplete and mathematically complex. A Ct value alone is incomplete quantitatively because the quantitative interpretation of a Ct value depends on the exponential-phase efficiency. As an example of Ct complexity, standard deviation Ct does not behave like a standard deviation.
Quantitative results should be reported as quantities, which are complete, mathematically simpler data points. Quantities can be calculated from Ct values and exponential-phase efficiency:
Equation 1
Quantity ~ e-Ct
Where:
Quantity = initial target gene quantity
e = exponential-phase efficiency, ideally 2 (target doubles each cycle)
Ct = threshold cycle
Real-time PCR quantification involving biological samples often includes a normalizer gene. Such a gene is used to measure sample mass and normalize target amount by sample mass to produce target concentration, which is biologically relevant.
Calibration is defining the unit of a data set. A common practice in real-time PCR is to use a sample or average of a group of samples as a “calibrator” (a.k.a., reference sample or group). The calibrator sample or group will have a relative quantity (RQ) of 1 and all other sample RQ values will be relative to that. Calibrators may either be relative or absolute.
In a 1997 document titled “User Bulletin #2,” Equation 1 was modified for sample mass normalization and calibration, and the exponential efficiencies were set to 100%. The resulting equation was called the comparative Ct or ΔΔCt method:
Equation 2
Relative Quantity = 2-ΔΔCt
Where:
ΔΔCt is the Ct value normalized by sample mass and calibrated.
Note, normalization of Ct values is performed through subtraction, rather than division, and the symbol Δ indicates subtraction.
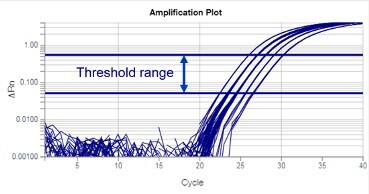
For quantitative assays, thresholds may be set within a range of ΔRn values in the exponential phase (Figure 4). In a log y-axis amplification plot, exponential phases end where the plots begin to curve to the right. Thresholds should not be set in this curved region due to worsening precision. In addition, thresholds should not be set too low where the data appear more variable. This variability is caused by poor signal-to-noise ratio.
Adjusting the threshold changes the Ct values of that assay, but if the threshold is set within a recommended range, Ct value changes are consistent. When using the ΔΔCt method, consistent Ct value changes do not significantly alter the resulting quantities.
Thresholds are not required to be the same for different assays, but they may be set to the same value for convenience if that threshold is acceptable for each assay.
Visual assessment of thresholds in the amplification plot is recommended to ensure they are in an acceptable range, even if using an automatic threshold algorithm.
Figure 4
Relative Threshold Method
Some real-time PCR software programs offer an alternative method to calculate Ct values called the relative threshold method. This method is automated, so there are no baseline or threshold settings to assess or modify. The algorithm identifies likely amplification signals and calculates Ct values at a consistent point based on the shape of each amplification plot. When using the relative threshold method, Ct values will be displayed as “Crt” values in the software, which identifies the method used to obtain them.
Real-time PCR software calculates quality control values, which may include Cq confidence, amp score and amp status. Assessing these quality control values is recommended to ensure Ct values were obtained from true amplifications.
Equivalent Ct Values
In addition to Ct values, some real-time PCR software programs display “equivalent” Ct values, which are what the Ct values would have been if the assay had 100% exponential-phase efficiency. If the assay efficiency remains at the default 100% in the software, Ct values and equivalent Ct values will be the same.
Changing the efficiency of an assay from the default 100% should only be done with great caution. A common method to calculate exponential-phase efficiency is based on the slope of a standard curve, but standard curve slopes fluctuate randomly. Using only assays with 100% exponential-phase efficiency for real-time PCR is recommended, because assays with low efficiencies create unwanted complexities. For example, if an assay has low efficiency, measuring the efficiency accurately will be difficult. In addition, the 40 cycles routinely used in real-time PCR will need to be increased to maintain sensitivity.
This article only scratches the surface of real-time PCR (qPCR). To learn more, visit these helpful resources:
- Understanding Ct Application Note
- Taq Talk video, Episode 3: Understanding Ct values in real-time PCR
- Taq Talk video, Episode 12: Baselines in real-time PCR
- Taq Talk video, Episode 13: Real-time PCR thresholds and where to place them
- Taq Talk video, Episode 14: How to tell if Ct values are real signal or background noise
- qPCR Handbook 2.0, digital experience