By Greg Kaduchak, PhD
What is “Event Rate”?
In flow cytometry, an “event” is defined as a single particle detected by the instrument. Accurate detection of events using flow cytometry requires the ability to separate single cells with specific characteristics from within a heterogeneous population of cells. This detection can be additionally complicated by the challenge of detecting the cells of interest in a limited sample or in the presence of cell debris or other artifacts of sample preparation.
When investigating a population of cells, it may be necessary to acquire 104 to 107 events to obtain a sufficient number of cells for statistically significant detection. The number of events needed for analysis depends on three main factors: the ratio of cells to debris in the sample, the signal-to-noise ratio of the detected cells compared to background fluorescence, and the frequency of the cell population of interest in the sample. Poisson statistics apply when counting randomly distributed populations, where precision increases as more events are acquired [1]. To determine the size of the sample (number of cells) that will provide a given precision, the equation r = (100/CV)2 is used, where r is the number of cells meeting the defined criterion of the rare event, and CV is the coefficient of variation of a known positive control.
How are Event Rates calculated differently and how does this differentiate between instruments?
I have recently received a number of questions related to the calculation of the Maximum Event Rate of a flow cytometry instrument. Much of the conversation has been directed toward how the Maximum Event Rate as calculated by different methods may affect instrument performance.
There are several methods by which Maximum Event Rate of a flow cytometer is calculated. A standard, more accurate method is to define the Maximum Event Rate as the analysis rate where 10% of all events are coincident (according to Poisson statistics). For this method, the coincidence rate is one of the main foundational values in the flow cytometer design. This is our method of design for the Attune NxT flow cytometer.
Another method is to cite the Maximum Event Rate of the electronic data collection system. This method has become more popular with some manufactures in recent years due to the advent of fast and less expensive electronic circuitry. A system designed with this method is agnostic to coincidence and thus, can result in a very high rate of coincidence at the instrument’s specified Maximum Event Rate.
Calculation of Maximum Event Rates:
- Standard method: Analysis rate where 10% of all events are coincident (according to Poisson statistics).
- Alternative method: Cite the Maximum Event Rate of the electronic data collection system.
Why is coincidence so important in a flow cytometer’s design?
Simply put, coincident events are indeterminate and do not possess valuable information. Worse, coincidence injects ‘polluted’ events into the experiment. Researchers attempt to gate coincident events out of their experiment by using bivariate plots with combinations of Height, Area and Width data, but unfortunately there is no method to fully remove them. Thus, to keep the data integrity as high as possible, it is best to keep coincident events to a minimum. In addition, it affects absolute counts as events that contain two or more particles count only as one particle.
How Does Calculated Maximum Event Rate Differ?
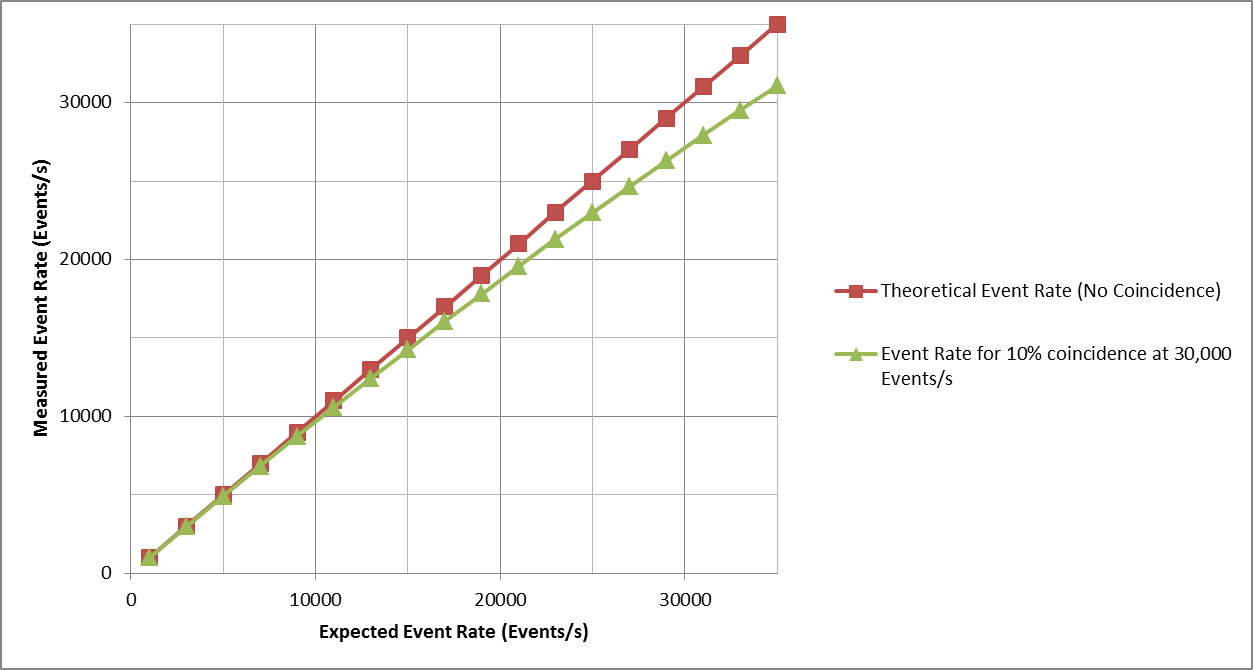
Let’s look at an example of how coincidence events enter the data as a function of analysis rate. Consider an instrument designed by using the 10% coincidence method with a specified Maximum Event Rate of 30,000 events/s. Below is a plot that shows the Theoretical Event Rate when no events are coincident. It also shows the Expected Event Rate which is the analysis rate that is measured when allowing 10% coincidence. As seen, the Expected Event Rate is lower than the Theoretical Event Rate since coincident events count only as a single event. At 30,000 events/s, one can see there is a 10% difference in the event rates (by design). One should note that coincidence increases as a function of analysis rate.

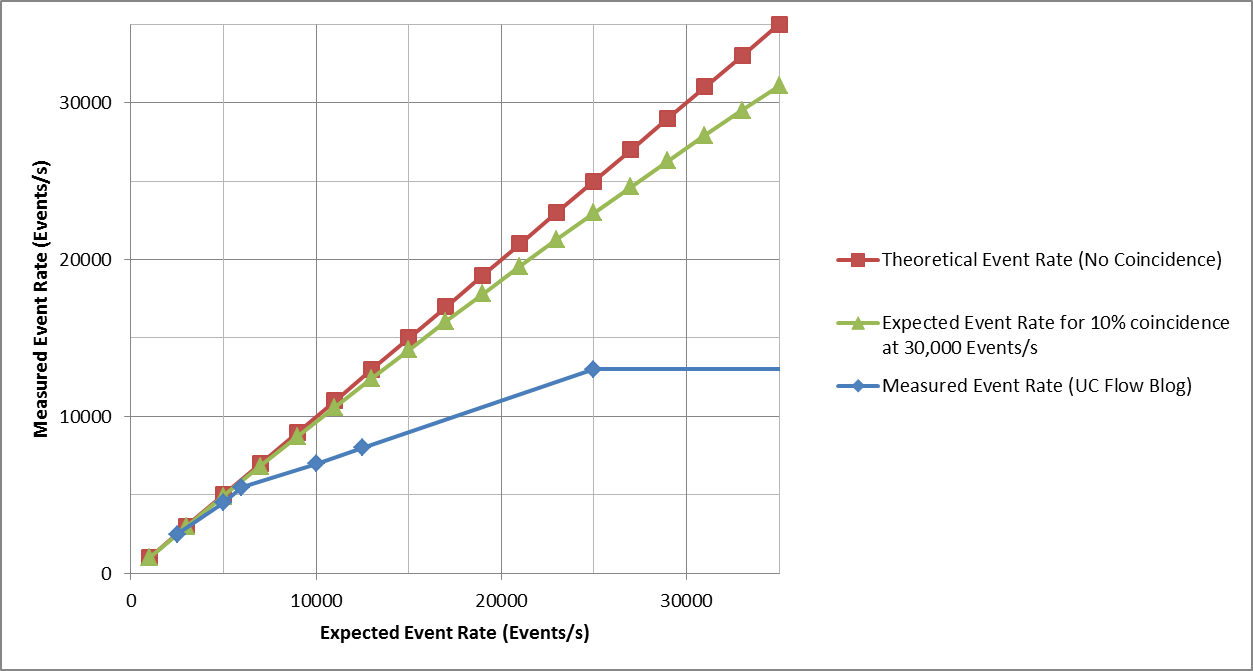
Next, add to the plot the data from an instrument review conducted by the University of Chicago.
The Measured Event Rate on this instrument deviates greatly from the Expected Event Rate calculated by the 10% coincidence method as opposed to the maximum speed of the electronics. As can be seen, not only does the Measured Event Rate deviate, it never attains an analysis rate greater than ~14,000 events/s!

Why such a large difference? It could be that their electronic system cannot process events at rates greater than 14,000 events/s. If this is the case, then 30,000 events/s is not attainable whether events are coincident or not.
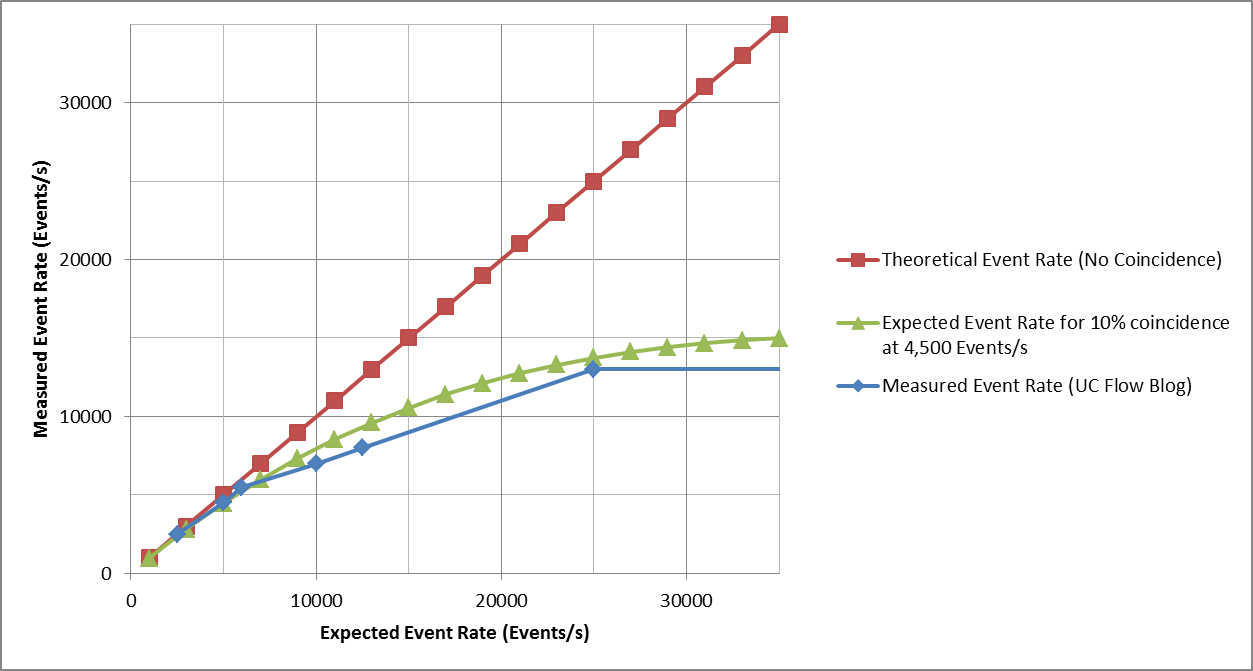
It is also possible that the instrument reaches such a high rate of coincidence that most events are coincident and counted as doublets, triplets, etc. For this assumption, let’s consider a cytometer designed for a maximum event rate of 4,500 event/s as calculated by the 10% coincidence method as shown in the graph below. The data looks strikingly similar to the measured test data. So, if the instrument’s Maximum Event Rate is calculated using the standard method and the same one used for the Attune NxT, the maximum event rate of this instrument would be 4,500 Events/s… not 30,000 Events/s. At 30,000 Events/s coincident events occur at a rate of ~15,000/s . . .

It is important for flow cytometrist understand these differences and how it can affect their research.
In an upcoming post, we will look at how a system can attain such high coincidence rates. Interestingly, it does not have anything to do with how much time the particles spend in the laser. But we will leave that discussion until then . . .
Reference:
For Research Use Only. Not for use in diagnostic procedures.
Leave a Reply