Search Thermo Fisher Scientific

Thermo Scientific FTIR spectrometer and microscope resources
Learn more about FTIR spectroscopy and get the resources you need
Here you can find everything FTIR, from the most basic (what do “FT” and “IR” mean?) to applications using hyphenated techniques, like TGA-IR. Along the way, you can find information on sample preparation for transmission experiments, the power of FTIR Microscopy and charts relating chemical structure to the infrared spectrum. Come back often, as this content is being updated continually.
FTIR basics
Your starting point for learning about FTIR, this section covers what “FTIR” stands for and how it works. We also introduce the main sampling techniques and provide a more extensive overview of how they can be used to answer your questions.
Introduction to FTIR spectroscopy
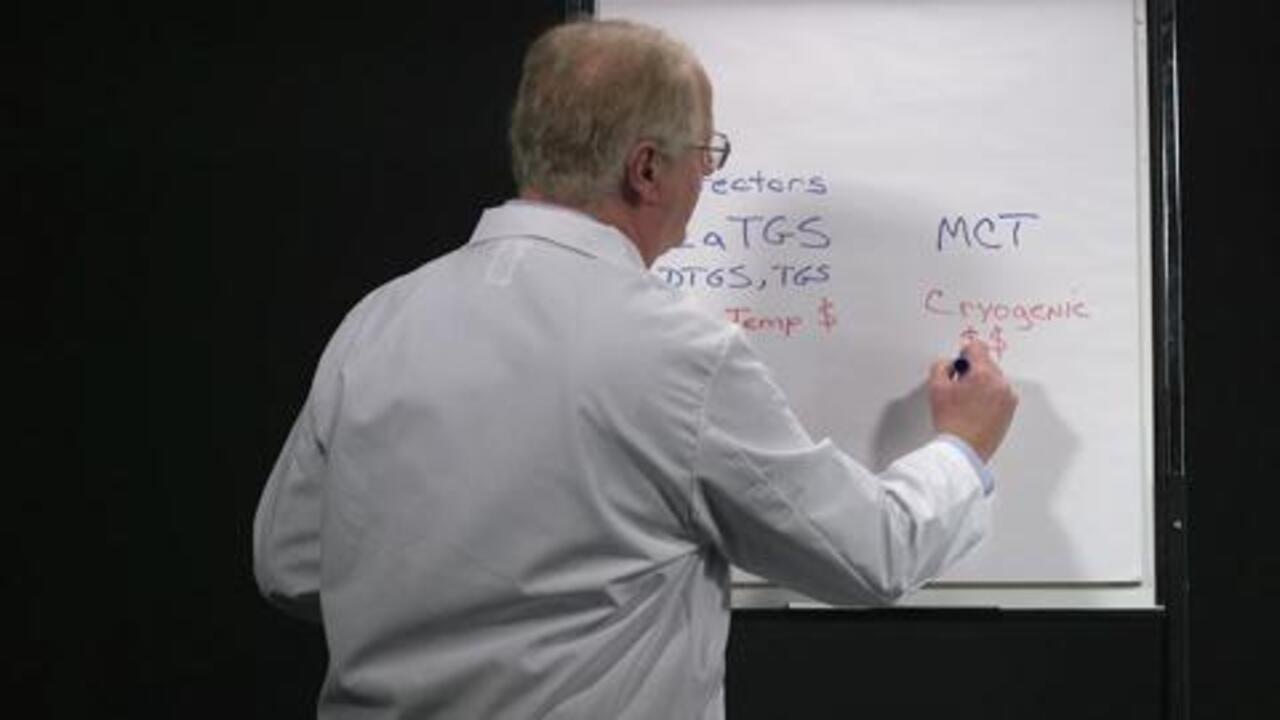
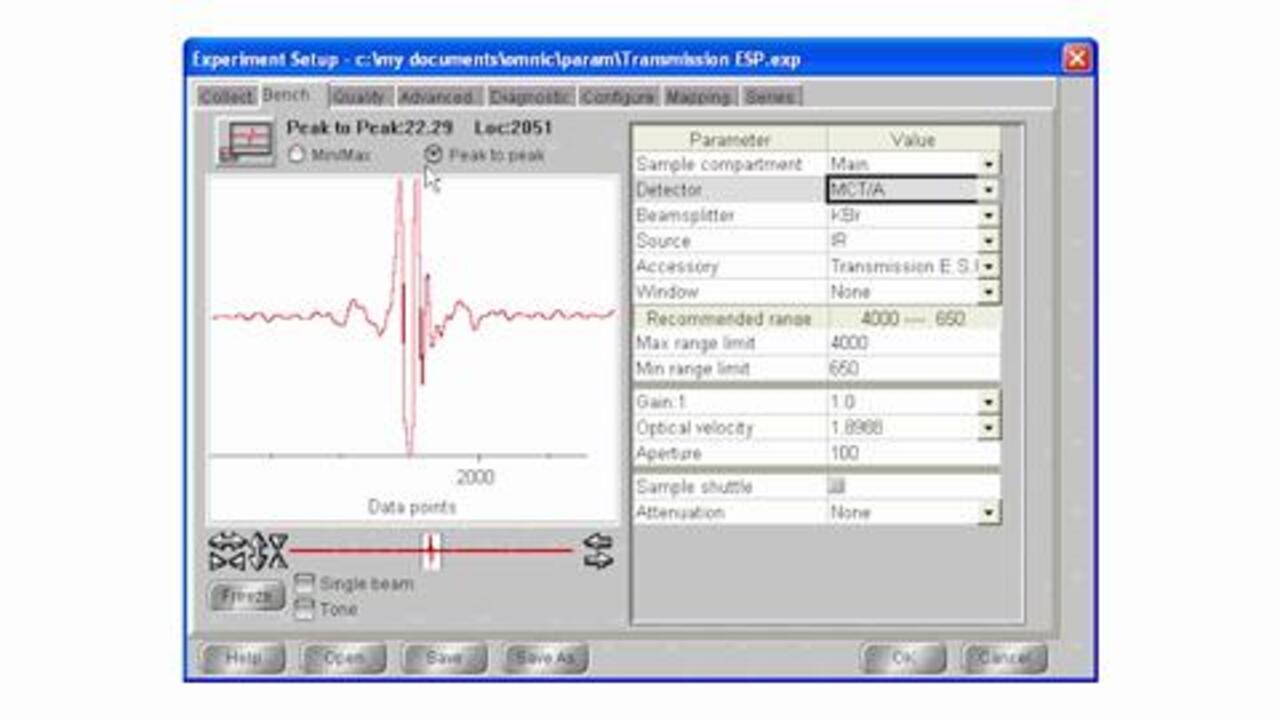
FTIR spectroscopy offers a vast array of analytical opportunities in academic, analytical, QA/QC and forensic labs. Deeply ingrained in everything from simple compound identification to process and regulatory monitoring, FTIR covers a wide range of chemical applications, especially for polymers and organic compounds. Learn more about the basics and the value of this popular technique by watching the tutorials below. Videos also provide an overview of two common detectors and the apodization function.
What is FTIR?
FTIR stands for Fourier transform infrared, the preferred method of infrared spectroscopy. When IR radiation is passed through a sample, some radiation is absorbed by the sample and some passes through (is transmitted). The resulting signal at the detector is a spectrum representing a molecular ‘fingerprint’ of the sample. The usefulness of infrared spectroscopy arises because different chemical structures (molecules) produce different spectral fingerprints.
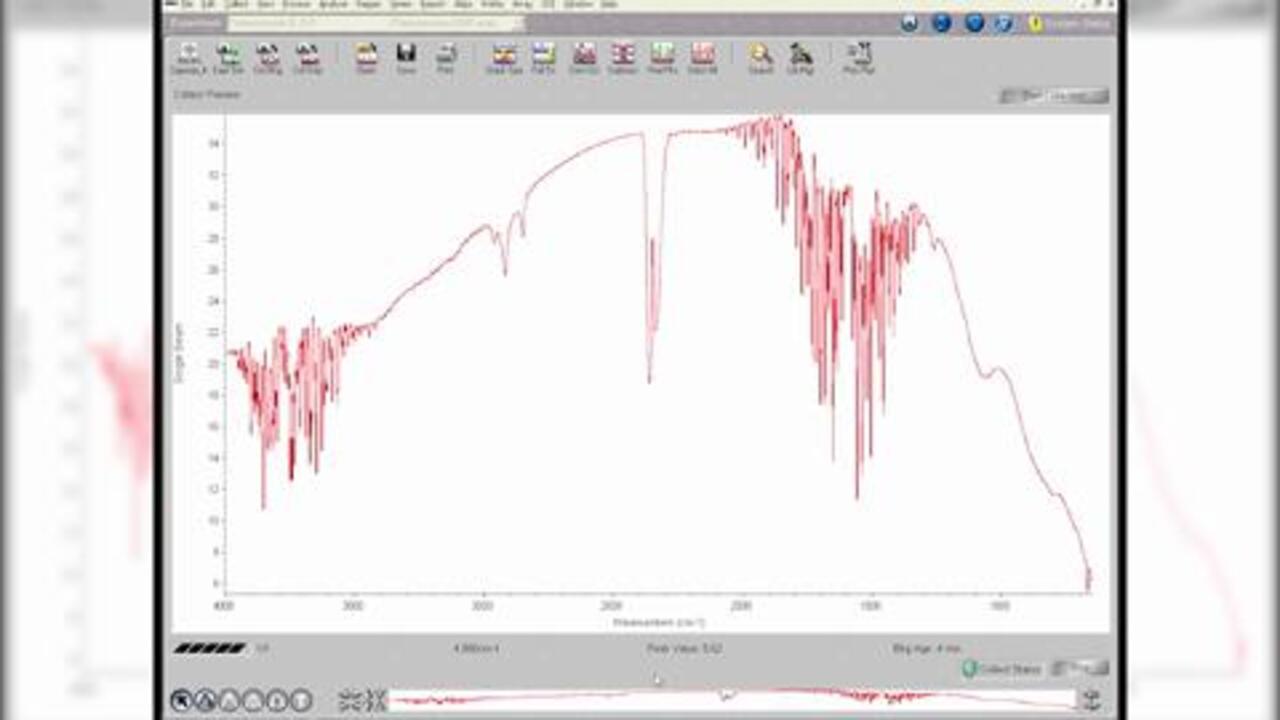
So, what is FTIR?
The Fourier Transform converts the detector output to an interpretable spectrum.
The FTIR generates spectra with patterns that provide structural insights.
Watch the tutorial for a quick description of what "FTIR" means and how the "FT" and the "IR" parts work together.

How does FTIR work and why use it?
The FTIR uses interferometry to record information about a material placed in the IR beam. The Fourier Transform results in spectra that analysts can use to identify or quantify the material.
- An FTIR spectrum arises from interferograms being ‘decoded’ into recognizable spectra
- Patterns in spectra help identify the sample, since molecules exhibit specific IR fingerprints

FTIR sampling introduction
There are four major sampling techniques in FTIR:
- Transmission
- Attenuated Total Reflection (ATR)
- Specular Reflection
- Diffuse Reflectance
Each technique has strengths and weaknesses which motivate their use for specific samples

Sampling and applications of FTIR
FTIR can be a single purpose tool or a highly flexible research instrument. With the FTIR configured to use a specific sampling device – transmission or ATR for instance – the spectrometer can provide a wide range of information:
- Most commonly, the identification of an unknown
- Quantitative information, such as additives or contaminants
- Kinetic information through the growth or decay of infrared absorptions
- Or more complex information when coupled with other devices such as TGA, GC or Rheometer
Ultimately, FTIR can be a cost-effective answer machine.
Watch the tutorial for a more extensive examination of FTIR sampling techniques, including hyphenated sampling. Examples are shown and discussed giving an overview of what is possible.

Featured FTIR detector videos
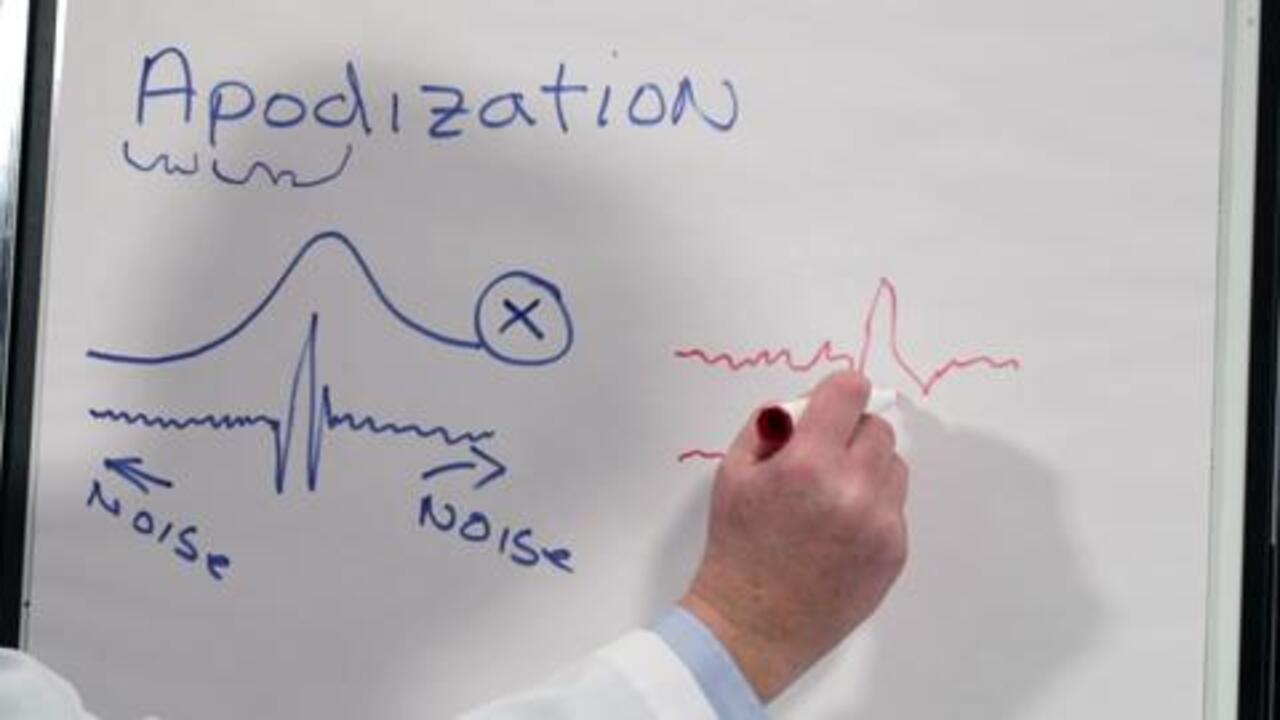
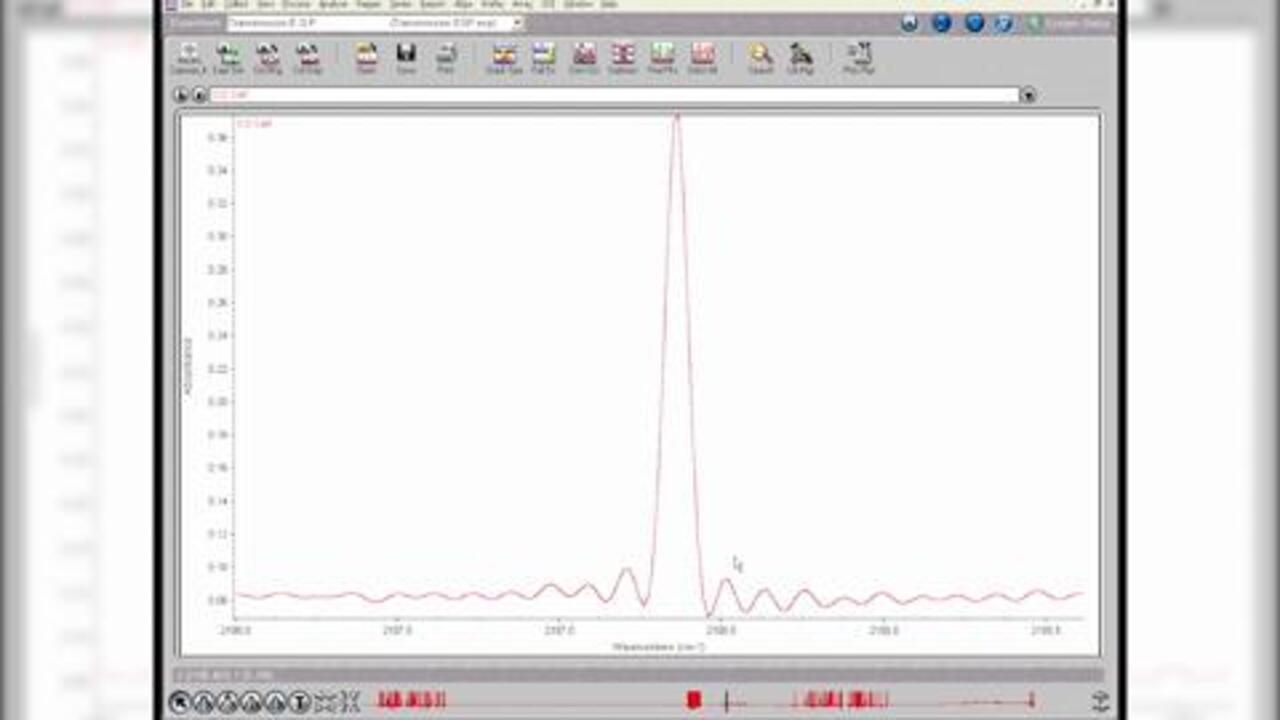
Featured FTIR apodization videos
Reference charts for spectroscopy and spectrometry


FTIR sampling techniques
An in-depth training section, this will cover transmission, reflection, DRIFTS and ATR accessories, their use and care. The reasons for choosing one or the other method will become clear, and the strengths of each method will be highlighted. Stress here is on sample preparation and experiment optimization.
Why is it important to know about different methods of sample handling?
Certain techniques of sample handling are more effective than others for specific sample types. To obtain the best quality spectrum from your sample, it is important to know which handling technique works best for your sample type. Acquiring the best spectral data possible will give you more confidence in your results.
FTIR sample techniques
Explore these four sample handling techniques to learn about how they work, what types of samples you can analyze and the advantages to using each technique.
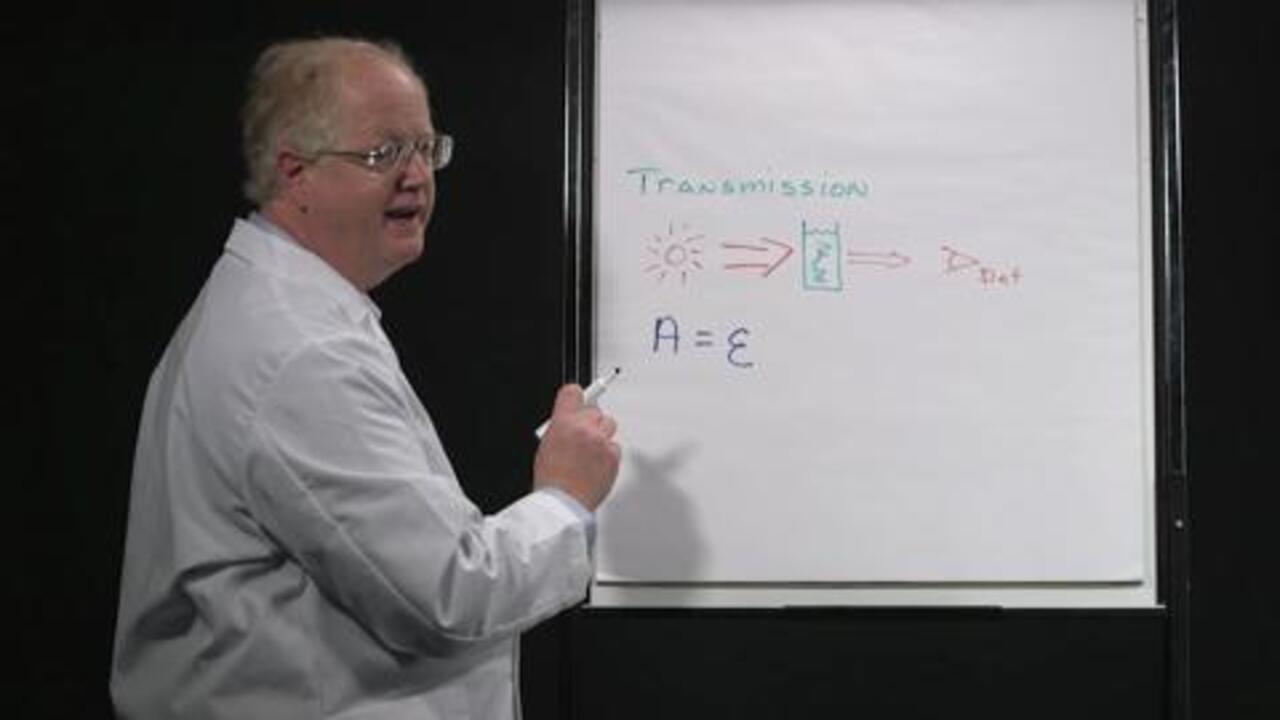
How does it work?
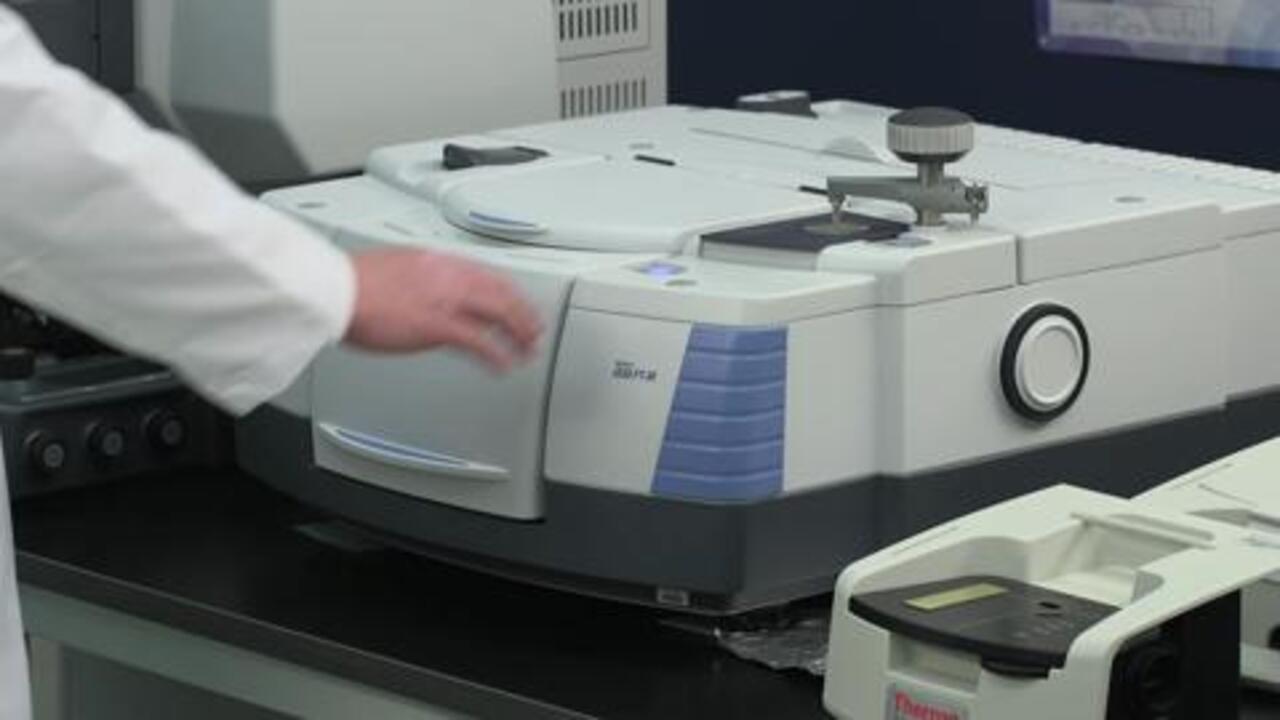
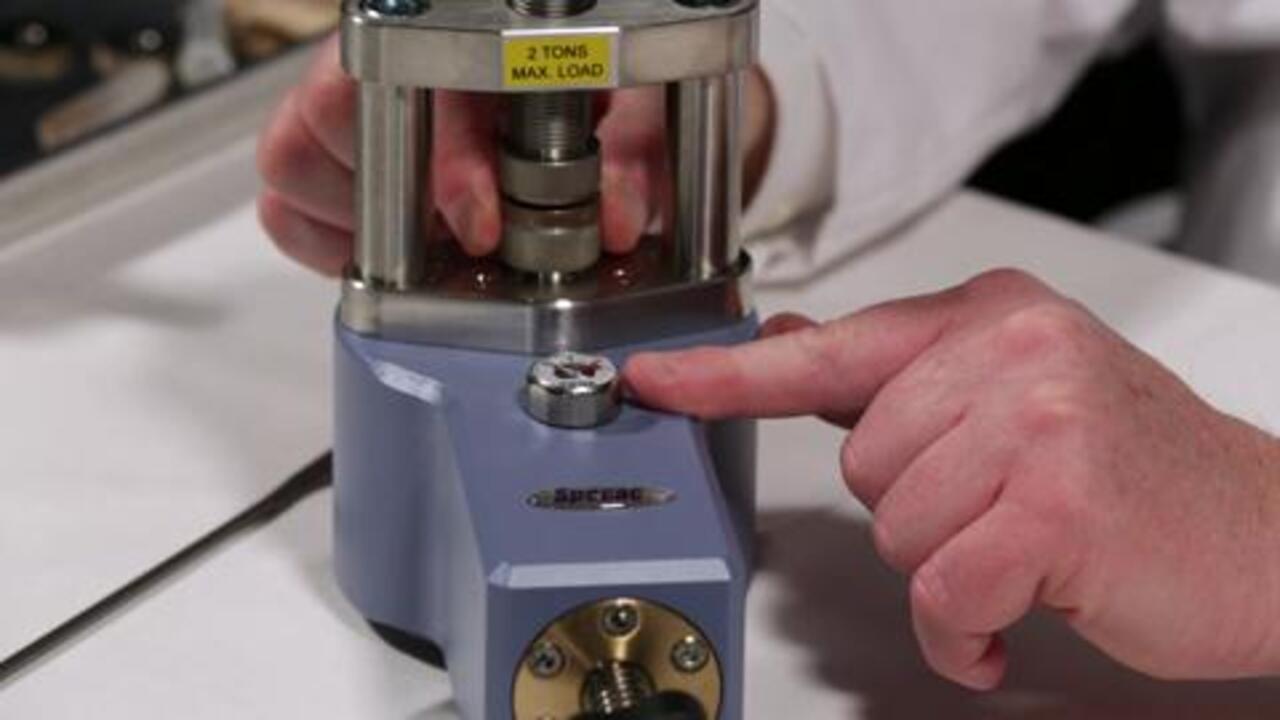
The transmission technique does not require a separate accessory. The user simply places a sample directly into the infrared (IR) beam. As the IR beam passes through the sample, the transmitted energy is measured, and a spectrum is generated. However, the analyst must often prepare the sample into a pellet, mull, film, etc. before the transmission measurement can be made. This requires expertise and can be time consuming.

What types of samples can you analyze?
Excellent quality spectra can be obtained for many types of samples using transmission. The transmission technique can be used alone or in conjunction with accessories such as microscopes and liquid or gas cells to analyze:
- Organic powders in pellet or mull form
- Thermoplastic powders
- Soluble polymers
- Thin polymer films
- Regular-shaped polymers (with preparation)
- Irregular-shaped polymers (with preparation)
- Dark polymer films (not carbon-filled)
- Liquids (free-flowing or viscous)
- Gases (high concentrations to trace amounts)
What are the advantages of transmission?
- Economical – cells and mounts are generally inexpensive
- Well established – most traditional form of sample measurement
- Excellent spectral information – ideal for qualitative measurements
- Great for quantitative work – many standard operating procedures are based on transmission
How does it work?
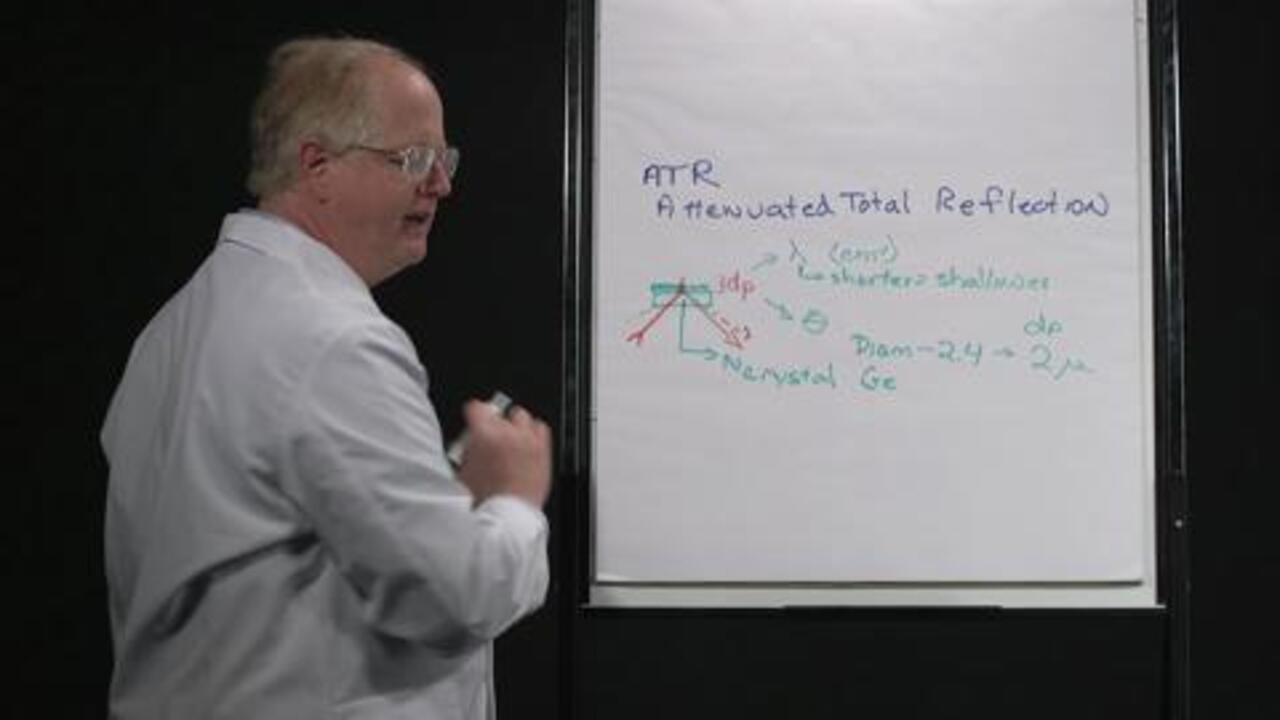
An ATR accessory operates by measuring the changes that occur in an internally reflected IR beam when the beam comes into contact with a sample. An IR beam is directed onto an optically dense crystal with a high refractive index at a certain angle. This internal reflectance creates an evanescent wave that extends beyond the surface of the crystal into the sample held in contact with the crystal.
")
In regions of the IR spectrum where the sample absorbs energy, the evanescent wave will be attenuated. The attenuated beam returns to the crystal, then exits the opposite end of the crystal and is directed to the detector in the IR spectrometer. The detector records the attenuated IR beam as an interferogram signal, which can then be used to generate an IR spectrum.
What types of samples can you analyze with ATR?
ATR is ideal for strongly absorbing or thick samples which often produce intense peaks when measured by transmission. ATR works well for these samples because the intensity of the evanescent waves decays exponentially with distance from the surface of the ATR crystal, making the technique generally insensitive to sample thickness.
Other solids that are a good fit for ATR include homogeneous solid samples, the surface layer of a multi-layered solid or the coating on a solid. Even irregular-shaped, hard solids can be analyzed using a hard ATR crystal material such as diamond. Ideal solids include:
- Laminates
- Paints
- Plastics
- Rubbers
- Coatings
- Natural powders
- Solids that can be ground into powder
In addition, ATR is often the preferred method for liquid analysis because it simply requires a drop of liquid to be placed on the crystal. ATR can be used to analyze:
- Free-flowing aqueous solutions
- Viscous liquids
- Coatings
- Biological materials
What are the advantages of ATR?
- Minimal sample preparation—place the sample on the crystal and collect data
- Fast and easy cleanup—simply remove the sample and clean the surface of the crystal
- Analysis of samples in their natural states—no need to heat, press into pellets, or grind to collect spectra
- Excellent for thick or strongly absorbing samples—ideal for difficult samples like black rubber
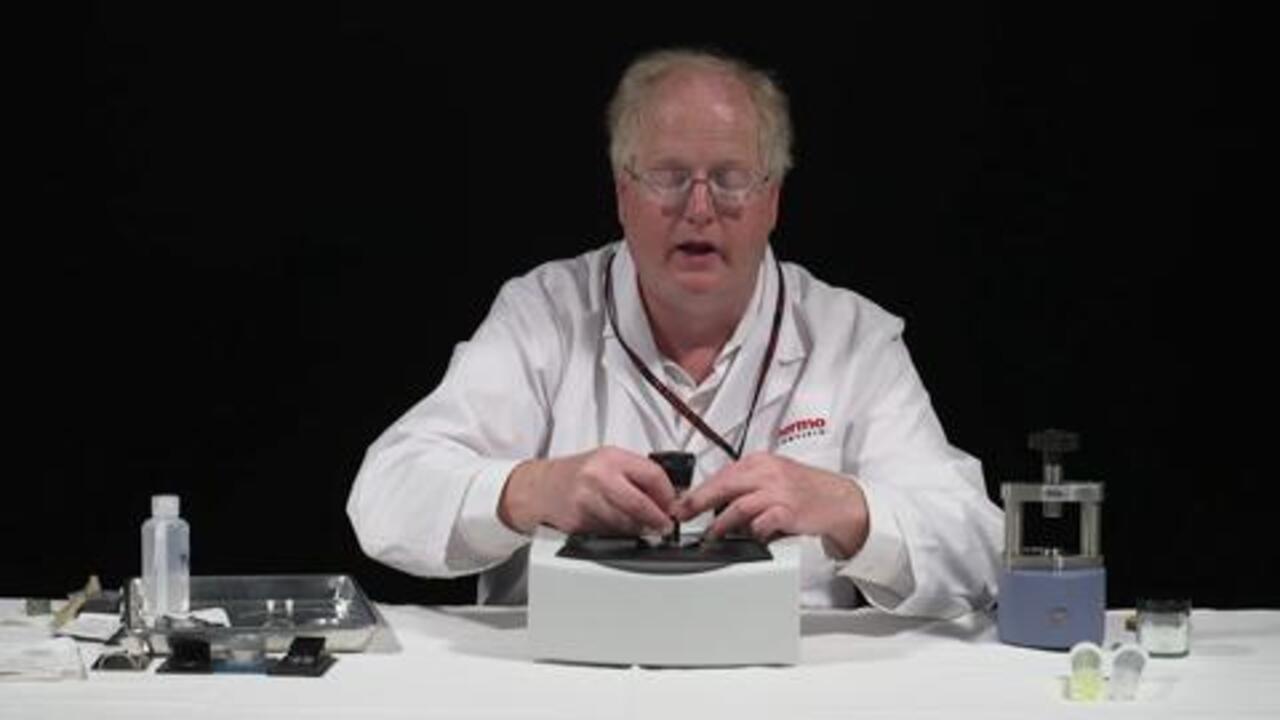
How does it work?
When an IR beam is focused onto a fine particulate material, the incident beam can interact with the particle in one of several ways. First, radiation can be reflected off the top surface of the particle without penetrating the particle. Second, the light can undergo multiple reflections off particle surfaces without penetrating the particle. True diffuse reflectance results from the penetration of the incident radiation into one or more sample particles and subsequent scatter from the sample matrix.
")
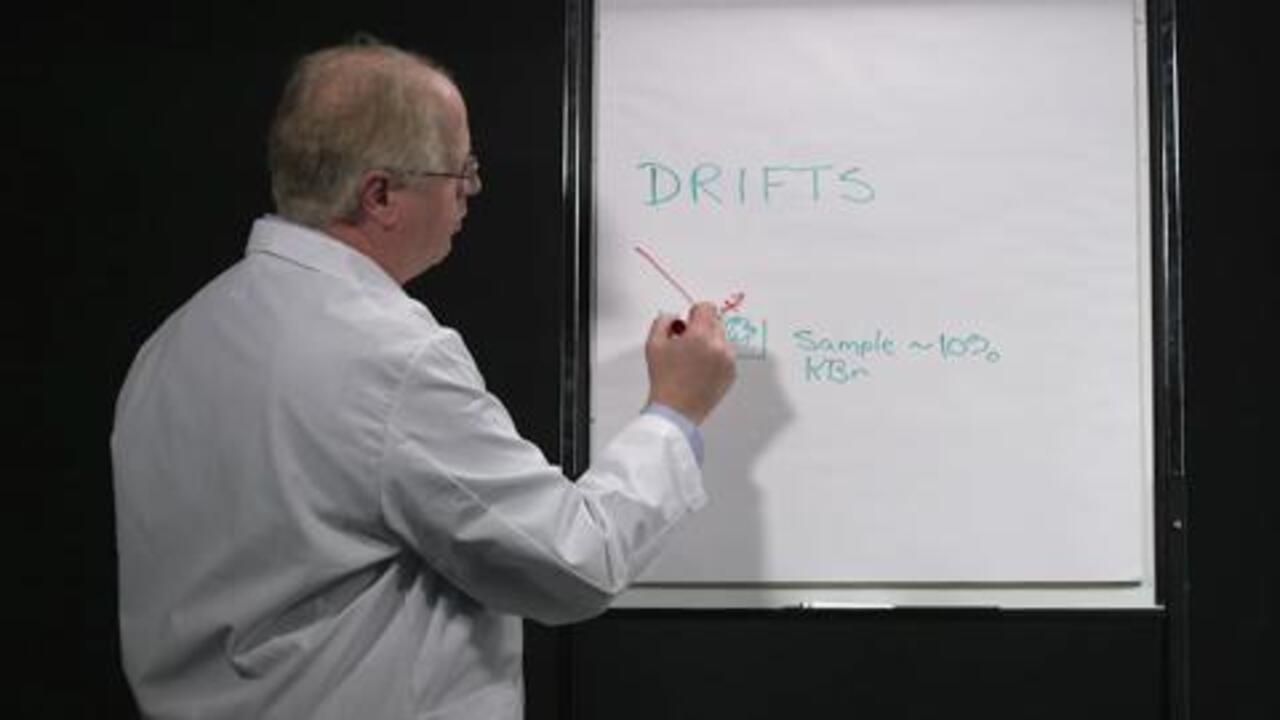
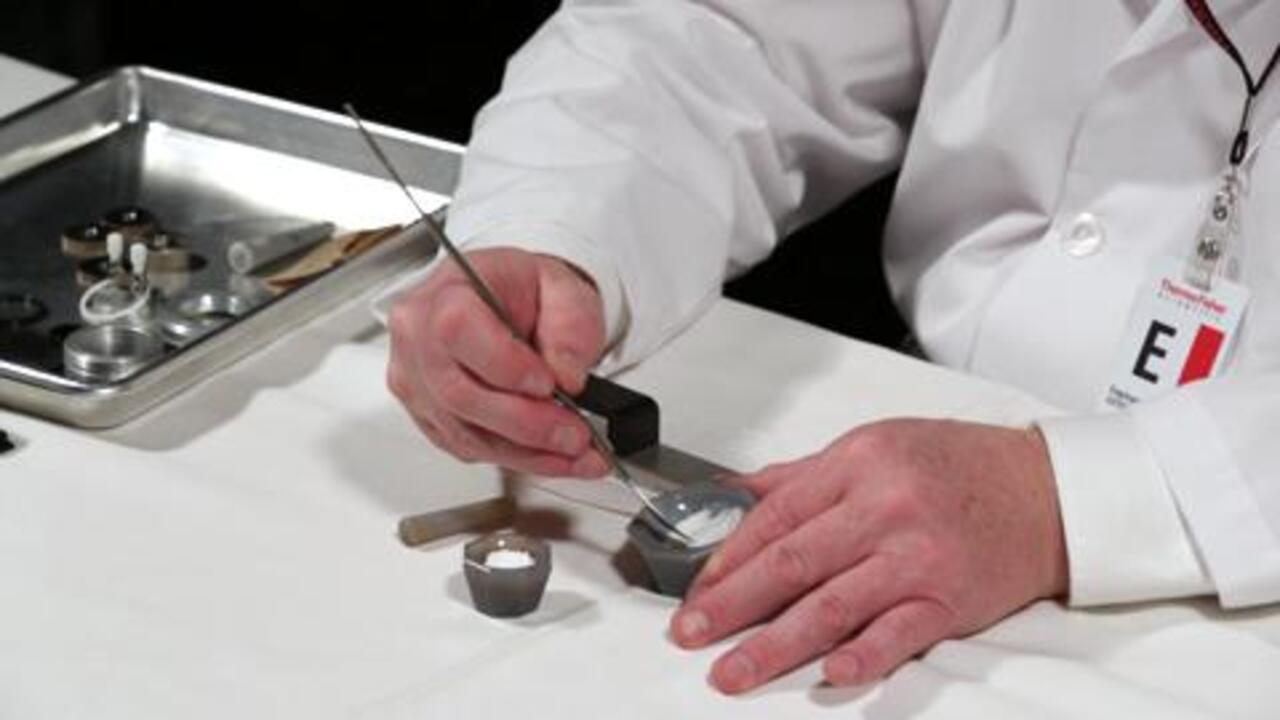
A DRIFTS accessory operates by directing the IR energy into a sample cup filled with a mixture of the sample and an IR transparent matrix (such as KBr). The IR radiation interacts with the particles and then reflects off their surfaces, causing the light to diffuse, or scatter, as it moves throughout the sample. The output mirror then directs this scattered energy to the detector in the spectrometer. The detector records the altered IR beam as an interferogram signal, which can then be used to generate a spectrum. Typically, a background is collected with the DRIFTS accessory in place and the cup filled with just the IR matrix. Excellent quantitative and qualitative data can be collected with proper sample preparation. However, transmission and ATR techniques are preferable to diffuse reflectance for quantitative data due to pathlength.
What types of samples can you analyze?
DRIFTS is commonly used for the analysis of both organic and inorganic samples that can be ground into a fine powder (less than 10 microns) and mixed in a powder matrix such as potassium bromide (KBr). Typical sample types include:
- Soft powders and powder mixtures
- Tablets
- Rigid polymers
The DRIFTS technique can also be used with silicon carbide paper for the analysis of large intractable surfaces. Silicon carbide paper can be used to rub off a small amount of a variety of samples for analysis. This technique is a viable alternative to traditional sampling techniques for:
- Paint and varnish surfaces
- Tablets
- Rigid polymers
What are the advantages of diffuse reflectance?
- Little to no sample preparation – just place in the sample cup
- Fast and easy cleanup – dump the cup and blow or rinse clean
- No need for pressed KBr pellets or messy mulls – samples can be run neat or diluted with KBr powder
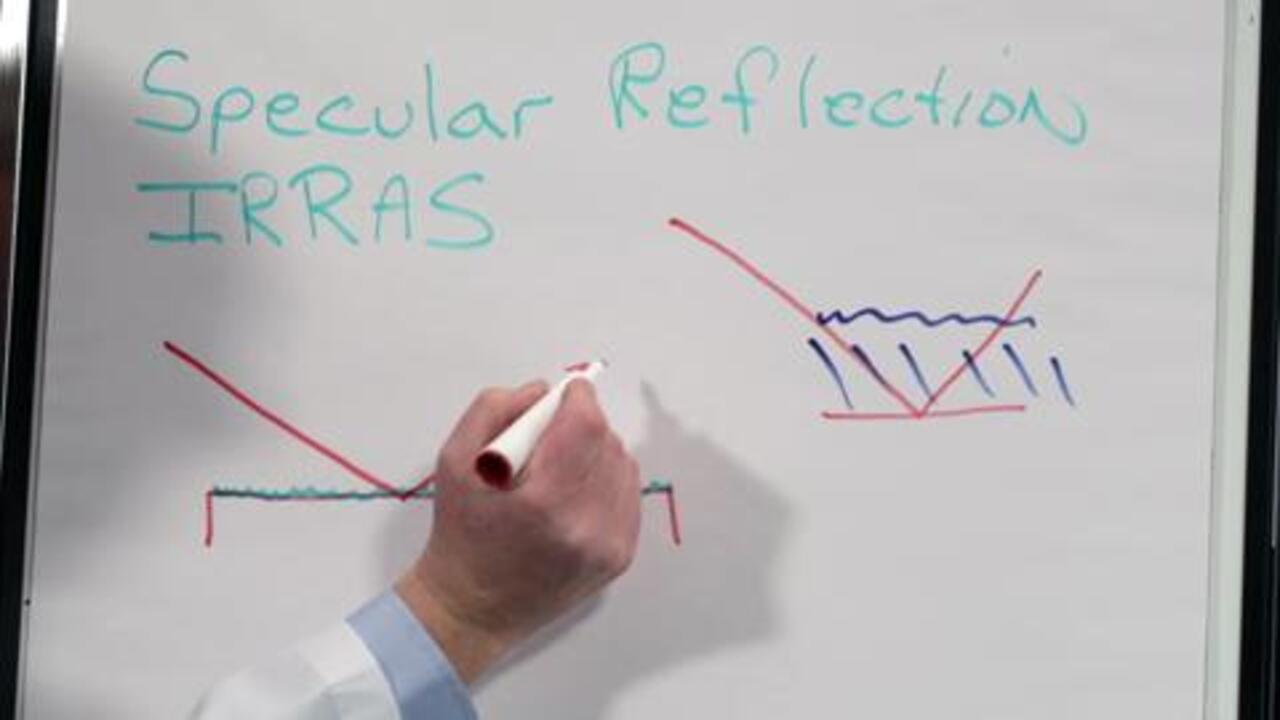
How does it work?
True specular reflectance is a surface measurement technique that works on the principle of reflective efficiencies. This principle states that every sample has a refractive index that varies with the frequency of light to which it is exposed. Instead of examining the energy that passes through the sample, true specular reflectance measures the energy that is reflected off the surface of a sample, or its refractive index. By examining the frequency bands in which the rate of change in the refractive index is high, users can make assumptions regarding the absorbency of the sample. The true specular reflectance technique provides excellent qualitative data.
Reflection-absorption works on the same principle, but due to sample properties, some of the energy passes through the surface layer, is absorbed into the bulk of the sample, and then reflects off a substrate below the surface layer. A combination of true specular reflectance and reflection-absorption can occur when criteria for both techniques are met. If a qualitative comparison to transmission spectra is desired, users can apply the Kramers-Kronig correction to the data to remove the effects of dispersion.


What types of samples can you analyze?
Specular reflectance is commonly used for the analysis of both organic and inorganic samples having large, flat, reflective surfaces. Reflection-absorption can occur when one of the above criteria is compromised and the sample has a reflective substrate present just below the surface. This type of analysis is commonly used for:
- Metallic surfaces
- Thin films on reflective substrates
- Silicon wafers
- Laminated materials on metals
What are the advantages of specular reflectance?
- Sensitivity to monolayer samples – can detect Angstrom thick coatings on metal substrates
- Nondestructive analysis – no contact or sample damage during analysis
- Wide range of accessories available – can utilize main spectrometer and microscope accessories depending on the size of the sample and the thickness of surface layer
FAQs
Our market leading expertise in FTIR and FTIR microscopy is not just about the instruments, but it is due to our wide experience and knowledgeable staff. We have gathered here many of the questions we have been asked and will add to this section frequently.
Presenting spectra as transmittance tends to emphasize the smaller peaks, so you can sometimes visually assess your sample better. Absorbance spectra are used for any quantitative analysis, spectral subtractions or other manipulations as the spectra are linear with concentration – transmittance spectra are not. For searching or more general use, it is really more of a personal preference. Older literature tended to use transmittance most often, while detailed peak analysis always moved to absorbance, again because of the linearity feature.
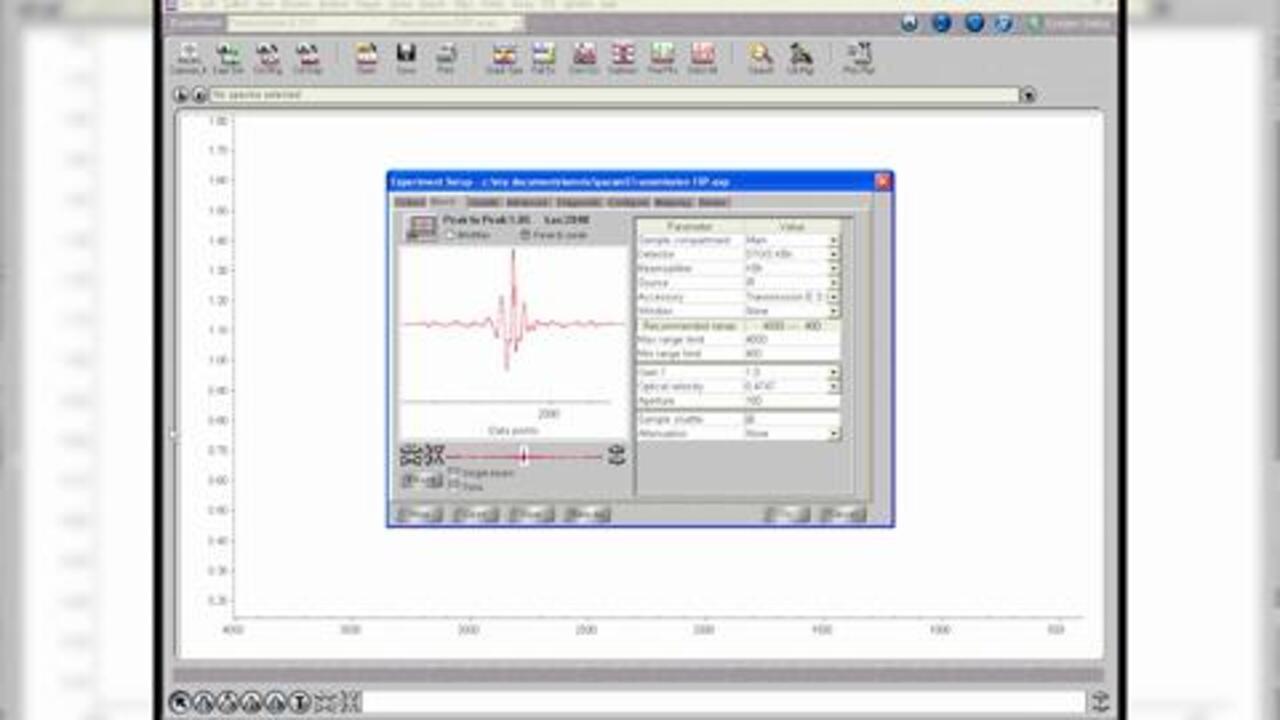
Apodization works on the interferogram. If you have that raw data – which Thermo Scientific OMNIC Software can do by setting a single check box – then post-processing by changing apodization is trivial. The interferogram typically requires a lot more memory than the Fourier transformed spectra, so older software packages used to throw away the interferogram to save memory. In cases where the interferogram is not present, you can’t reprocess: apodization is a time domain function.
Apodization can increase from light (like Happ-Genzel) to heavy (like Blackman-Harris). The heavier the function, the more affect you will see on lineshape. For most normal uses, when the resolution is 4 wavenumbers or more, even heavy apodization does not distort spectra badly. However, as the lines narrow, as in gas-phase spectroscopy, the effect of apodization can be profound. Strong apodization in broad peaks improves the signal to noise over Boxcar (essentially no apodization) by a lot with minimal effect on linewidth. H-G was the original OMNIC default (and still often is) due to its “gentle” effect on linewidth coupled with decent signal to noise. Generally, S/N improves in the order H-G, Norton-Beer Weak, NB-Medium, NB-Strong, Blackman-Harris, while lineshapes are also affected more in the same order.
Quantitative work requires one of two approaches. First, you may know or can calculate the absorptivity (the epsilon in Beer’s Law). This is exceedingly rare. Much more commonly, you develop a set of training / calibration standards and record spectra. You then either use a chemometrics package like Thermo Scientific TQ Analyst Software to automate the analysis using Beer’s Law or more complex modeling, or you can record basic information (peak height or peak area) in a spreadsheet and then use linear (or non-linear) regression. It is generally the same idea as done for chromatography or atomic spectroscopy.
FT-IR responds to a change in dipole moment, regardless of whether it is organic or inorganic. Metal oxides, carbonates and carbonyls are good examples. The basic equation states the wavenumber is proportional to the square root of the spring constant (bond strength) and one over the square root of the reduced mass. Simply put, as mass of the atoms involved in the bond goes up, the wavenumber goes down. Many inorganics have peaks below 400cm-1, such as ferrocene, acetylferrocene, and cadmium oxide. This necessitates the use of “far-IR” optics. Many forensics users have found far-IR useful in identifying paint chips, due to their inorganic content. There are several ATR accessories that now permit far-IR ATR (mostly monolithic diamond devices). The Thermo Scientific Nicolet iS50 FT-R Spectrometer was designed to make far-IR performance trivial with a built-in ATR as well. Ultimately, if you have further interest in this area, you need to speak with an FTIR salesperson to understand the capabilities and limitations.
DRIFTS is used in both mid-IR and near-IR. In the mid-IR, DRIFTS requires the sample be blended with diluents like KBr, with 3-10% sample. This is typically undesirable as the sample is now mixed. However, DRIFTS is heavily used in catalysis research where powdered material is exposed to high temperature, elevated pressures, and mixtures of reactant gases. Several accessory suppliers make devices specific for this. In the near-IR, DRIFTS is used without dilution through direct measurement – many hand-held probes exist allowing analysis through a container wall (like plastic bags) meaning the sample can be analyzed without touching or contaminating it. ATR involves making contact with the sample by forcing it into contact with a crystal. ATR generally does not require dilution and works well with solids like credit cards or car bumpers which would be tough in DRIFTS. ATR has, for the most part, displaced DRIFTS in the mid-IR except in special cases, while DRIFTS remains a method of choice in the near-IR world.
One key experimental step in protein analysis is the removal of the water bands (most proteins are in buffers). This requires highly controlled path-length transmission cells or ATR. Most historical work was done in 6-10 micron path length transmission cells using BaF2 or similar windows. The analytical region is roughly between 1400 and 1750cm-1 where these windows are transmissive. Recently, ATR devices using silicon, germanium or diamond windows have become more prevalent. Reactions or binding of proteins to the crystal can occur with ZnSe devices (due to surface charges); sometimes this is desired but often it is not. Most of the literature is based on transmission cells. Protein analysis requires skill and consistency, so training is essential for most laboratories.
The Beer-Lambert law is based on stable samples and reproducible conditions. In ATR, you have two concerns. First, the sample must make contact with the crystal in a consistent manner. If the material is rough or crystalline, you must ensure reproducibility. Grinding the material to a fine powder may be necessary. Second, ATR is a surface technique, examining the sample to a depth of around 1-4 microns. If the additive or target molecule is migrating further away, you will lose the signal. In this case, transmission, which illuminates the entire sample and entire thickness, may be a viable option (depending upon thickness). In some cases, the application of pressure can change the signal due to changes in the crystallinity or orientation of polymer strands in the sample. Any deeper insights would require an understanding of the specific sample involved.
For Research Use Only. Not for use in diagnostic procedures.