Search Thermo Fisher Scientific
- Order Status
- Quick Order
-
Don't have an account ? Create Account
Search Thermo Fisher Scientific
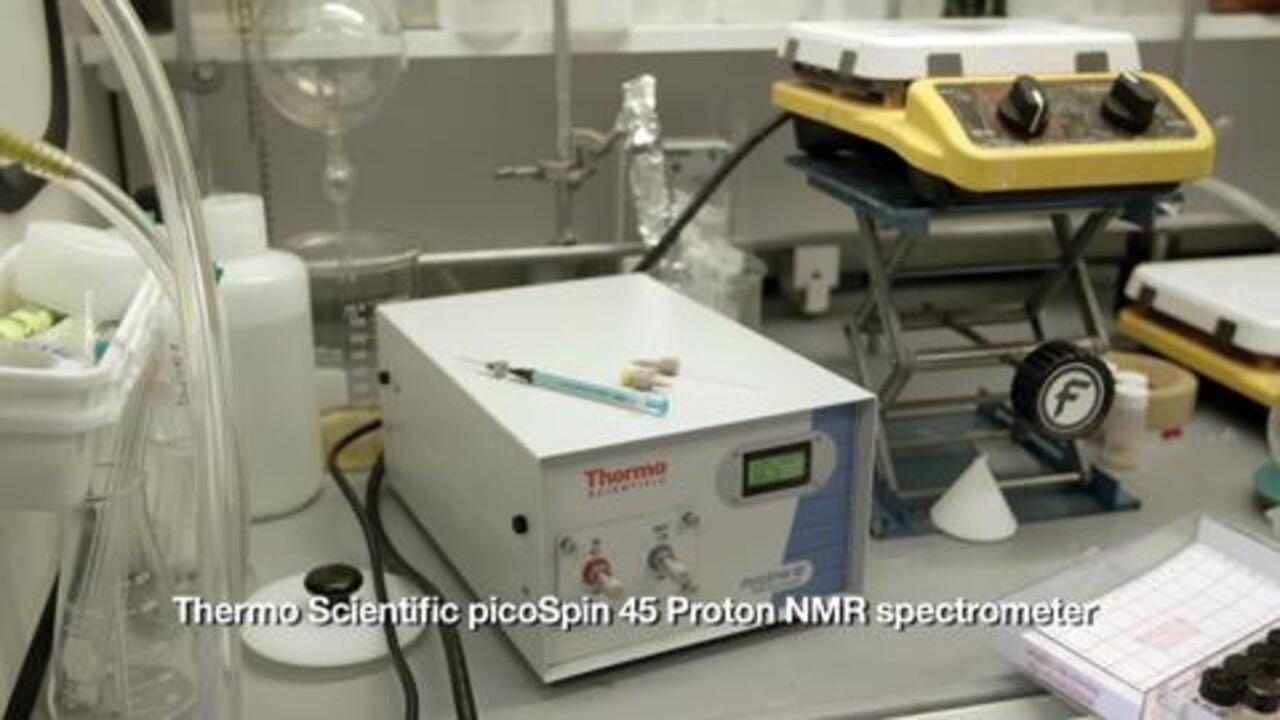
NMR spectroscopy is the method of choice for many organic chemists because of its versatility in elucidating molecular structure, optimizing reaction dynamics, measuring reaction kinetics, monitoring reaction content and controlling product purity. NMR spectroscopy provides a wealth of information on physical, electronic, chemical and structural aspects of molecular systems. It is a nondestructive technique ideally suited for measuring and recovering small sample quantities. NMR complements other techniques, such as FTIR, UV-Vis spectroscopy and mass spectrometry, providing a wealth of molecular-scale information. Now, instead of relying on limited access to an expensive central NMR facility, you can have an inexpensive, compact and reliable NMR spectrometer right in your own lab.
The spectrum below demonstrates the capability of the Thermo Scientific picoSpin NMR spectrometer, revealing the characteristic triplet-quartet splitting pattern of the ethyl group in ethanol. High signal-to-noise ratio and high resolution marks the picoSpin 45 as a true spectrometer, providing quality spectra at a small fraction of the cost of conventional NMR spectrometers.
Often chemists need to establish the current state of their reaction – perhaps a reaction isn't proceeding as expected. Is the stoichiometry off, or is an impurity present? NMR could tell us right away what may be the problem, but the NMR lab is booked, and you need results immediately. With a picoSpin-45 spectrometer, you can obtain results in a matter of minutes, and make adjustments to your reaction pot today, not next week.
The NMR spectrum of ethanol above indicates the presence of an impurity signal at 4.3 ppm in what should have been a sample of pure compound. Preliminary analysis of this sample of ethanol would have prompted the chemist to dry the solvent prior to use, saving valuable time. The spectrum of ethyl acetate below indicates a samples free of impurities.
Below are several examples of spectra of prescription and over-the-counter (OTC) medications obtained using the Thermo Scientific™ picoSpin™ NMR spectrometer.
Below are several examples of some common chemical solvents. All spectra were acquired from pure samples, except where noted, and used without further purification. Thermo Scientific™ picoSpin™ 45 NMR spectra were acquired using a 90-degree pulse angle, 750 ms acquisition time, 10 s recovery delay, and are an average of 16, 24, 48, 64, or 72 scans.
Sarah Dimick Gray
Assistant Professor
picoSpin 45 NMR Spectrometer Customer

Dr. David Weldon
Assistant Professor, Pharm Sci
picoSpin 45 NMR Spectrometer Customer
Dr. Brandon English
Chemistry Instructor
picoSpin-45 NMR Spectrometer Customer
Access a targeted collection of application notes, case studies, videos, webinars and white papers covering a range of applications for Fourier Transform infrared spectroscopy, Near-infrared spectroscopy, Raman spectroscopy, Nuclear Magnetic Resonance, Ultraviolet-Visible (UV-Vis) spectrophotometry, X-Ray Fluorescence, and more.

")
")
")
 in CDCl3)")
")
")
")
")
")
")
, containing Ethyl Acetate, Ethanol, and Water")
")
")
")
")
")
")
. Hydroxyl and methylene proton coupling resolved")
. Resolution of hydroxyl-methylene proton coupling diminishes as rapid proton exchange with water protons increases")
. Hydroxyl-methylene proton coupling no longer visible")
")
")
")
. Stated content: 75-90% o-, m-, p-Xylene; 10-25% Ethyl Benzene")
