Search Thermo Fisher Scientific
- Order Status
- Quick Order
-
Don't have an account ? Create Account
Search Thermo Fisher Scientific
Quality assurance and quality control (QA/QC) are crucial not only to ensure that the finished battery meets specifications but also throughout the research, development, and manufacturing process. Failure analysis (FA) and rejection are important to improve the production process and maintain quality.
Thermo Fisher Scientific offers instruments and software for battery QA/QC methods spanning electron microscopy, image analysis, spectroscopy, and chromatography/spectrometry.
Even under clean laboratory conditions, impurities are inevitably introduced during the battery production process. Impurities such as Fe, Cr, Zn, and Cu particles in battery raw materials have significant impact on electrochemical performance and material stability, and can even cause internal shorts with severe battery safety issues.
Although ICP-OES is widely used as a standard manufacturing QC process to detect impurities, it does not provide information such as size and composition, which is needed to identify the contaminant source in the materials production environment and help optimize the manufacturing process. The Thermo Scientific Phenom ParticleX Battery Desktop SEM provides an automated SEM-EDS workflow that can identify and quantify impurities in battery materials.
 Identified particle contamination in NMC powders The Phenom ParticleX Battery Desktop SEM was used to identify impurities in NMC powders and populate the final data table with composition and size information. The fully automated workflow helps identify impurities in battery raw materials with high throughput.

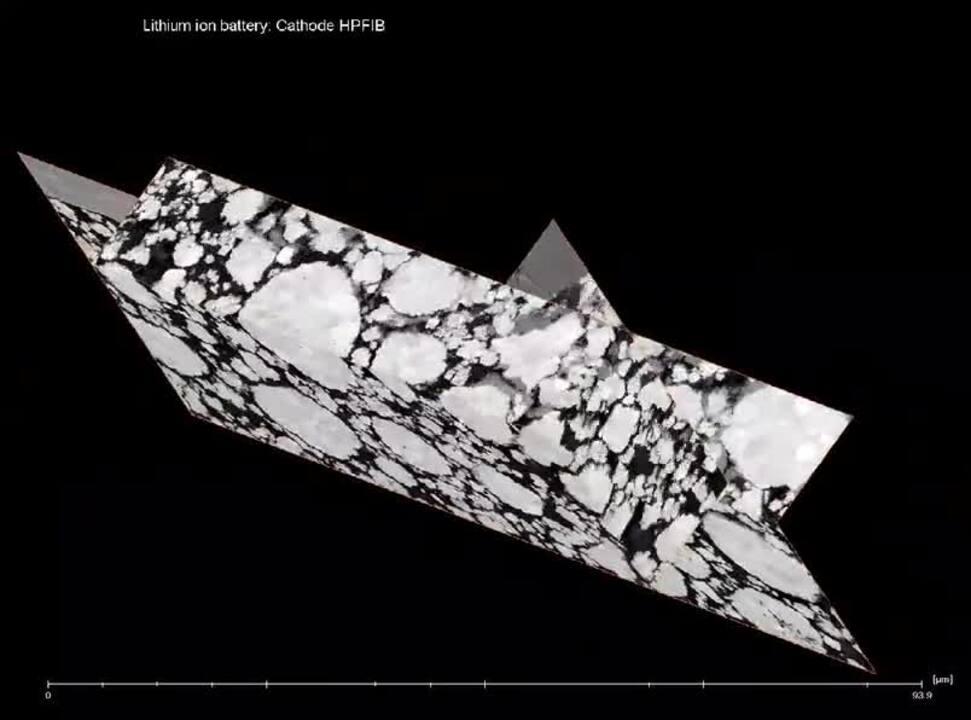
As manufacturers optimize the performance of the final lithium battery, it’s also important to check the quality of the cathode electrode surface. Any defects or contamination can cause the final lithium battery to rapidly degrade, shortening its overall lifespan.
The Thermo Scientific Phenom XL G2 Desktop SEM has been used to study defects that arise during manufacturing. By pairing this instrument with 3D reconstruction software for cathode QC, the manufacturer can not only detect the presence of defects and contaminants but also determine their source.
 Detecting abnormal cathode regions with Desktop SEM and 3D reconstruction software. Using the Phenom XL G2 Desktop SEM, lithium battery manufacturers can easily detect abnormal regions of cathode electrodes (left) where the area appears more porous and the cathode particles are flattened and fractured.

 Micro-crack analysis of a degraded battery cathode. Thermo Scientific Avizo2D software was used to analyze a grayscale SEM image of a series of NMC cathode cross-sections and color-code grains (purple), cracks in the grain (red), matrix or background (gray), and binder interface (green). Graphs show volume fractions at six different cross-section locations. Data collection courtesy of Ron Kelley, Thermo Fisher Scientific. Sample provided by Prof. Shirley Y. Meng, University of California, San Diego.
Challenges for current Li-ion battery technologies include limited lifetime and energy density. Quantitative analysis of microscopic cracks in cathode grains can help researchers better understand battery degradation and improve performance. However, it is difficult to accurately analyze these micro-cracks without being an image processing expert.
Using Thermo Scientific Avizo2D Image Processing Software, we worked with one customer to build a simple four-phase detection analysis of SEM cross-sections of a lithium nickel manganese cobalt oxide (NMC) cathode. In this analysis, we identified and color-coded grains (purple), cracks in the grain (red), matrix or background (also called porosity, gray), and binder interface (green). Avizo Software was able to quantify the differing proportions of each material at six different slices of the cathode. We also developed a simple workflow that the customer can apply to similar SEM acquisitions.


 Electrode length in a fresh vs aged battery. The structure of a Li-ion battery is changed by numerous cycles of charging and recharging. It is possible to control this degradation by monitoring the length of the electrodes. As the electrode curves, the radial distance (between its ends) changes. Images were processed and analyzed using Avizo3D Software.
Micro-computed tomography (microCT) instruments non-destructively generate 3D reconstructions of samples by placing them on a rotating stage and illuminating them with a micro-spot X-ray source. The transmitted X-rays influenced by the material are captured by a detector, creating a 2D projection (the tomogram). A series of these projections, collected as the sample rotates, can be recombined into a digital 3D model and analyzed using Avizo3D Software.
Production quality control. Non-destructive analysis of a battery by microCT and Avizo Software can identify possible internal defects that may have occurred during manufacturing, such as soldering, leakage, delamination, and porosity.
Failure analysis of aging and degradation. Incremental changes occur to a battery during multiple charging cycles, leading to degradation. MicroCT enables non-destructive investigation of the mechanisms behind this process. The number of cycles is one of most important factors for a rechargeable battery and is impacted by changes to foil, anode, and cathode morphology (length, radial distance, etc.), as well as core leakage.
To fully understand mechanisms of degradation, a sample must be examined at different scales, from the cell level (~18 mm) to the electrode level (~80 µm) to the particle level (~10 µm). But correlating imagery from different instruments operating at different scales can be challenging. After identifying a region of interest (ROI) at the macro scale, acquiring micro-scale data about it on a different instrument can be like finding a needle in a haystack.
In this correlative defect analysis of a pouch cell battery, an X-ray scan by an industrial CT instrument was used to identify an ROI containing a defect. Avizo Software was used to define the ROI with georeferencing information, allowing a laser PFIB instrument to expose the defect. EDS analysis was used to characterize the defect composition, mapping the cobalt, manganese, nickel, and carbon content.
 Correlative defect analysis of a pouch cell battery. Avizo software was used to add geocoordinates to a ROI identified by CT, allowing a laser PFIB instrument to focus on the defect. EDS analysis was used to map the cobalt, manganese, nickel, and carbon content in the defect area. Once completed, the workflow was automated to enable near-line inspection of future defects. CT analysis courtesy of Waygate Technology; Laser PFIB analysis courtesy of Letian Li and Remco Geurts.
One important focus of Li-ion battery research is understanding why performance degrades over time. Research indicates that the solid electrolyte interphase (SEI) layer formed on the surface of the electrode is key to performance. The SEI layer, which is formed by the deposition of organic and inorganic compounds during the first several charge/discharge cycles, stabilizes the electrode from further decomposition and promotes reversible capacity. Because the SEI layer is complex, many analytical techniques can contribute to understanding its formation and behavior.
The figure shows a micrograph of the anode cross‐section after extraction from a used battery in an argon-filled glove box with the copper current collector in the center and anode material coated on both surfaces. Superimposed is the color-coded Raman image created on a Thermo Scientific DXR3xi Raman Imaging Microscope from the spectral differences shown by the inset Raman spectra. The Raman image clearly shows that the coating on one side of the copper current collector is dominated by carbon black (labeled red) while the other side has a much greater density of the active graphite phase (labeled blue).
This example demonstrates the advantage of Raman imaging over traditional single-point measurements. The major differences in the two coatings could easily have been missed by single-point measurements, depending on where the points were measured.

Challenge |
Technologies |
Solution |
Resources |
Identification of impurities for root cause analysis is difficult using CT alone |
CT/SDB, EDS, Avizo |
A correlative CT/laser PFIB workflow can identify deeply embedded impurities without disassembling the cell |
App note: Multiscale 3D imaging solutions for Li-ion batteries |
Failure analysis requires high-resolution cross-section polishing while still protecting sample |
SEM, CleanMill |
Thermo Scientific CleanMill offers a dedicated workflow for air-sensitive samples, an ultra-high energy ion gun for fast polishing, and a cryogenic function to protect sample integrity |
|
Differentiate carbon allotropes, reveal anode material structure, and track changes during usage |
Raman |
Raman spectroscopy is particularly useful for distinguishing between different allotropes of carbon and evaluating the structural quality of these materials |
App note: Raman analysis of lithium-ion batteries – Part II: Anodes |
Map degradation of the anode SEI layer |
Raman |
Raman microscopy can be used for visualizing changes to electrode materials and component distributions after a cell has been used |
|
Monitor battery off-gassing or chemicals released during a fire, short circuit, or other hazardous conditions |
FTIR |
The Thermo Scientific Antaris IGS System with Heated Valve Drawer can quantify release of HF and other fluorinated gasses under overtaxed conditions like a vehicle crash |
|
Assess crystallinity, stability, and reactivity in battery materials |
XRD |
Check crystal structure, crystallinity, orientation characteristics, thickness, homogeneity, and density of thin films and layers |
|
Detect defects, inclusions, and imperfections |
XRF |
Elemental mapping and small spot analysis down to 0.5 mm |
App note: Sample analysis using elemental mapping at low power with Thermo Scientific ARL PERFORM’X 1500 W Advanced WDXRF Spectrometer |
App note: Sample analysis using mapping with ARL PERFORM’X Series XRF spectrometers |
|||
Control the purity of anodes, cathodes, electrolytes, separators, and other components |
XRF |
Wavelength dispersive X-ray fluorescence (WDXRF) allows routine, daily monitoring and control of impurities and contamination |
|
Quantify trace elements in lead and lead alloys according to current standards for lead-acid batteries |
OES |
The Thermo Scientific ARL iSpark Optical Emission Spectrometer enables trace and alloying element analysis in lead-acid batteries |
Analysis of lead and its alloys with the ARL iSpark OES spectrometer |
Abbreviations: Avizo = Avizo Software; CT = Computed tomography; EDS = Energy-dispersive X-ray spectroscopy; FIB = Focused ion beam; FTIR = Fourier transform infrared spectroscopy; OES = Optical emission spectrometry; PFIB = Plasma focused ion beam; SDB = Small DualBeam; SEI = Solid electrolyte interface; SEM = Scanning electron microscopy; XRD = X-ray diffraction; XRF = X-ray fluorescence.


Webinars
Brochures
Application notes and case studies
Battery imaging and analysis blog posts
For Research Use Only. Not for use in diagnostic procedures.