Search Thermo Fisher Scientific
Resources for online analyzers
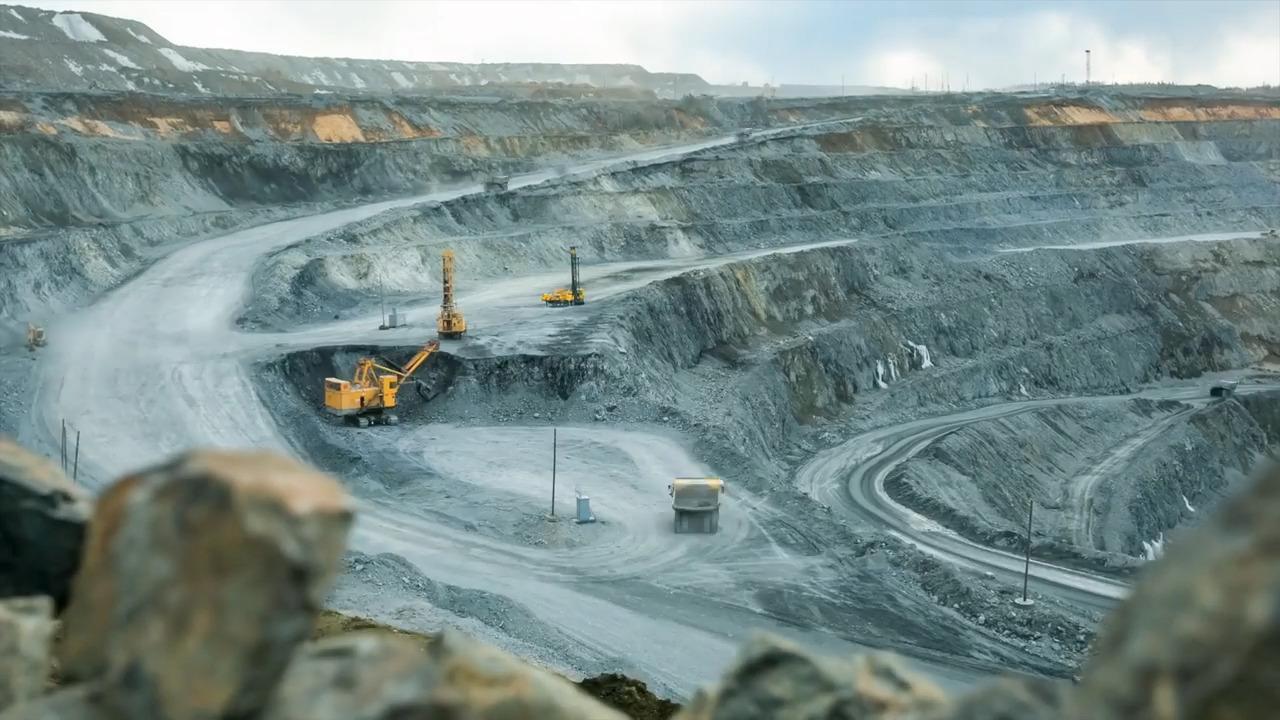
Browse our resources – including FAQs, videos, webinars, brochures, application notes, and more – to learn about our reliable and robust online analyzers for the processing industry.
Featured videos
Subject matter experts interviews

Webcasts
Documents
FAQs
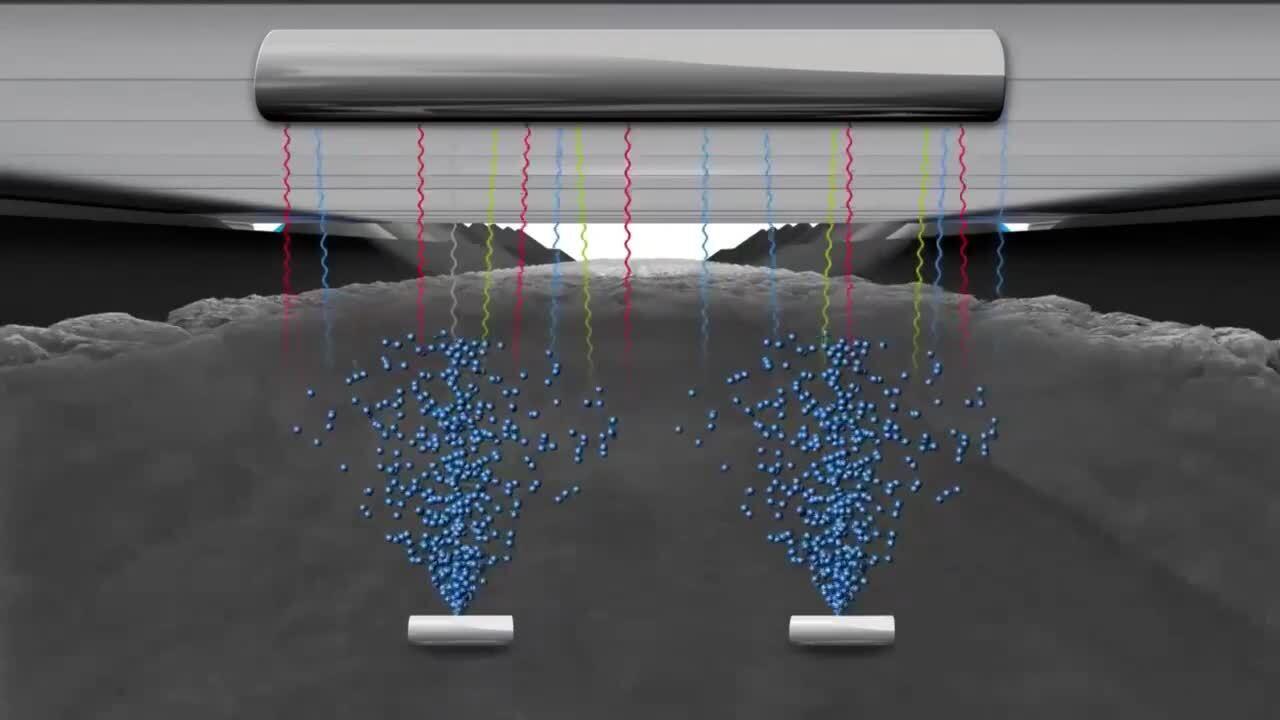
PTFNA and PGNAA are both neutron activation analyses which means measurement is reliant on a neutron source. With PTFNA the source is an electrical neutron generator while with PGNAA it is a radioactive isotope such as Californium 252. Other than neutron source, which affects suitability for certain applications, the two techniques are essentially identical.
PFTNA/PGNAA offers moderate to excellent detection capability for industrially relevant lighter elements such as calcium, chlorine, sulfur, aluminum, silicon, magnesium, sodium, and hydrogen which are less easily detected by XRF. Elements with an atomic number of 20 or less release fluorescent X-rays that are less energetic, relative to heavier elements, and therefore more easily attenuated, which makes XRF more challenging in slurry.
Key features are source type/strength and detector size/quality since these define measurement uniformity across the belt and data quality. More powerful sources mean higher neutron counts, in effect a higher signal while multiple sources provide more uniform coverage across the belt. Larger or better-quality detectors more effectively capture gamma rays released by the sample with multiple detectors enabling more uniform capture across the belt.
To maximize the value of a cross belt analyzer for a specific application you should therefore look for flexibility and performance with respect to both source and detector with a view to optimizing for either repeatability or uniformity across the belt, depending on which is more important. Weight, size, and ease of installation are also critical factors when it comes to the practicalities of installing an analyzer.
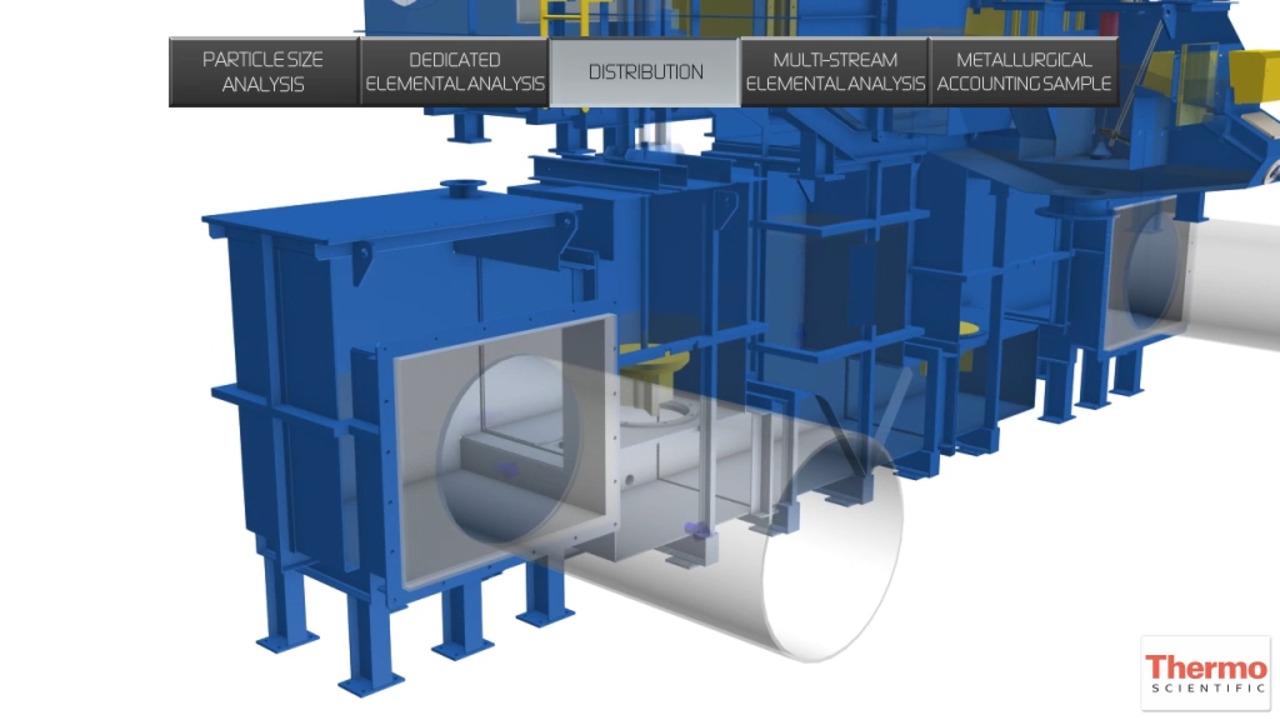
If you have the freedom of a new build, then it’s vital to be aware of the broader ramifications of choosing dedicated slurry sampling and analysis stations which are linked with the criticality of head loss and pumping costs. All slurry sampling is associated with head loss, but it can be minimized by selecting a dedicated, low pressure drop sampler with integral analyzer to deliver lower plant heights and/or less pumps. With the smart use of dedicated stations, it is therefore possible to save on construction materials (concrete and steel) and costs, and at the same time shorten project timelines. These are major gains. In contrast, centralized analyzers, however good, necessitate a more complex process flow diagram with all the inefficiencies that go along with it.
Well-designed dedicated analyzers require only minimal cleaning and maintenance for reliable operation over the long-term. The sample transport associated with centralized systems, on the other hand, requires the addition of pumps and small-bore sample lines adding additional complexity and failure points to the system. These have potential to affect data availability and cost of ownership due to the maintenance, running costs, and emissions associated with pump operation. Such systems are often installed with good intentions and a sound understanding of the practice required to keep them in good working order, but over the years enthusiasm and rigor tend to dwindle. Abandoned lines are common with centralized analyzers, an important point to note when assessing upfront CAPEX.
The other significant difference between multi-stream and dedicated analyzers is measurement frequency. For streams that justify real-time measurement, or as close as is feasible, dedicated analyzers are unbeatable.
When implementing online analysis there are two key questions to consider: What can I measure? And what can I control to affect that measurement?
Let’s take grinding circuit control as an example. A measurable variable is the particle size of the exiting material, and it can be controlled by parameters such as mill throughput and speed of rotation. How often to measure is then the next question. With manual control a large interval between measurements inhibits an operator’s ability to adjust the process effectively. There’s long lag between taking action and seeing the result. Increasing measurement frequency, to the limit of real-time measurement, improves feedback allowing the operator to learn how to ‘steer’ the circuit more effectively. The result will be steadier operation with an automated, well-tuned control loop the best solution for driving variability to a minimum.
If you can measure and tightly control a vital characteristic of a key stream, in a grinding or flotation circuit, or elsewhere on the plant, then the rewards can be substantial. If you can’t influence a measurable parameter then there is far less impetus to measure it at all, or with any frequency, though measurement may still be valuable for upset monitoring. Focus on how you would use data if you had it to identify the best places for investment and the frequency of measurement that will be most useful.
If you’re aiming for automated process control then that’s only practical with high availability, 95% should be an absolute minimum. Otherwise, switching to and from manual will be arduous and problematic with respect to operational efficiency. If availability is not demonstrably high then operators cannot rely on an analyzer, whether control is manual or automated, and it never becomes an integral part of the control architecture.
In the grinding circuit under-grinding typically means poor metal recovery (mineral processing) or sub-standard product (cement). Over-grinding, on the other hand, drives up energy consumption and results in undesirable levels of fines. Milling just enough balances these competing impacts. Online real-time particle sizing analysis makes it possible both to identify an optimal setpoint for particle size and then reliably maintain it.
In a flotation plant there is an analogous balance to establish. Poor separation means excessive metal loss while excessive reagent addition is expensive and environmentally undesirable. Here real-time elemental analysis can provide the information needed to identify the operational sweet spot and optimal control in the face of changes in particle size, ore mineralogy and pulp density.
In both cases, with real-time data changes tend to be more frequent but smaller, i.e. the plant stabilizes, with automated control minimizing variability.
Justifying any decision around online analysis requires careful and fair consideration of the associated upside.
For a decision around dedicated sampling/analysis stations for a new build make a conservative estimate of savings in materials and don’t underestimate the value of time. A few months saving on the construction timeline translates directly into an earlier swing from expenditure to income, an inflection point that can’t come soon enough for most projects.
For process control, consider the current situation to determine the magnitude of possible gains. For example:
What is a recovery improvement worth for your process?
If you could reduce impurities in the concentrate what would that mean for selling price?
What’s the difference in flotation reagent consumption, best to worst current case? What would be the savings if you consistently hit the best case?
How much are you overmillingover milling to avoid overly coarse material exiting the grinding circuit? What would be the energy savings if you weren’t? Online analysis should pay its way, and easily, so calculations such as these should readily highlight optimal areas for economic implementation and provide evidence to support investment.
For Research Use Only. Not for use in diagnostic procedures.