Cryo-electron tomography sample data analysis

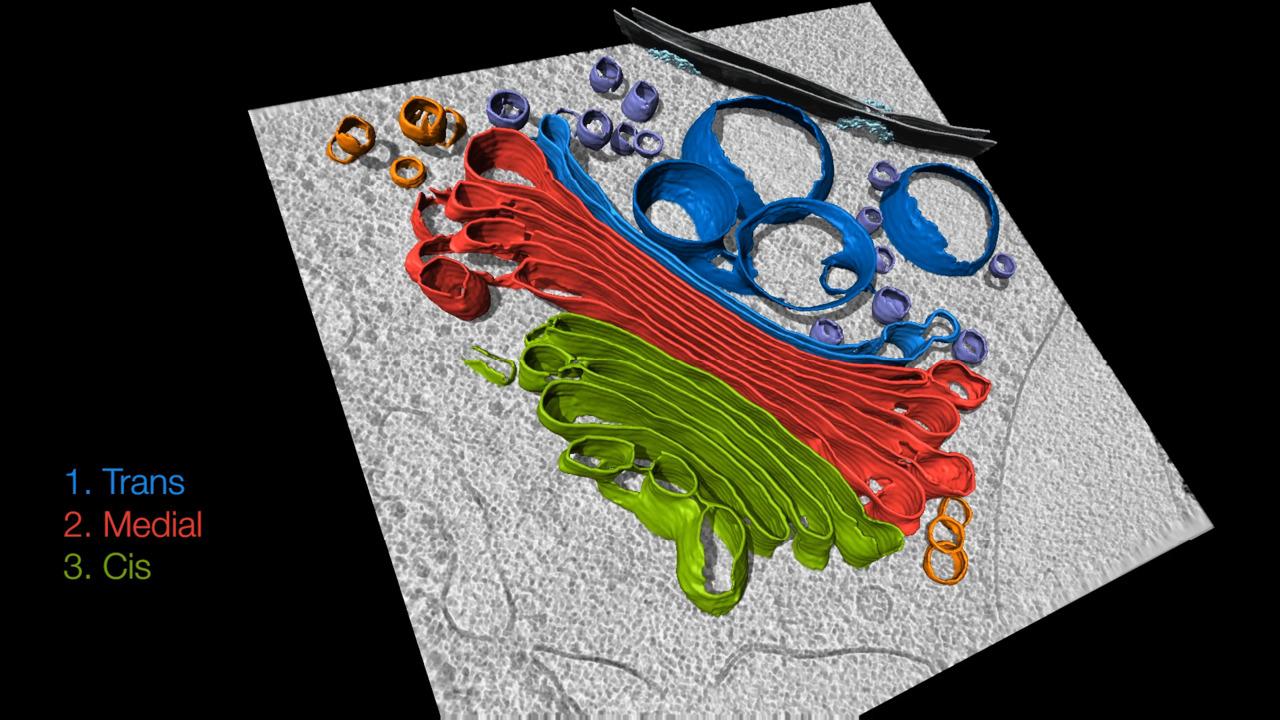
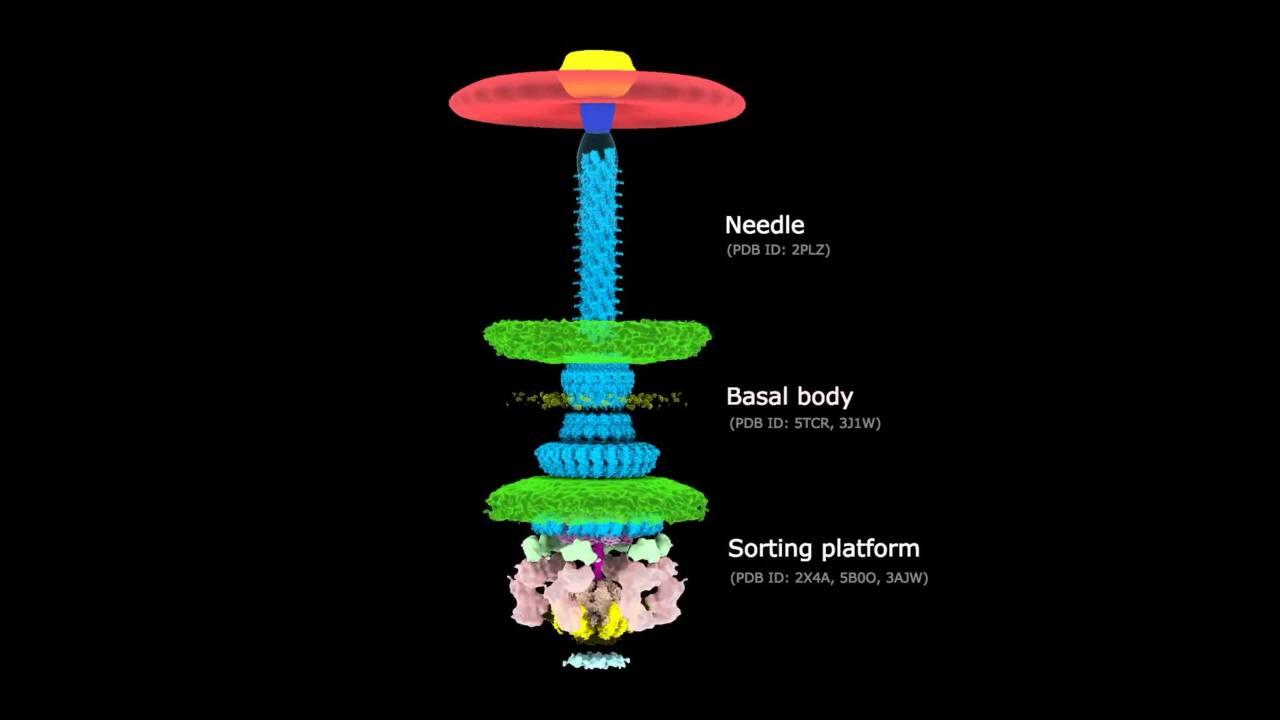
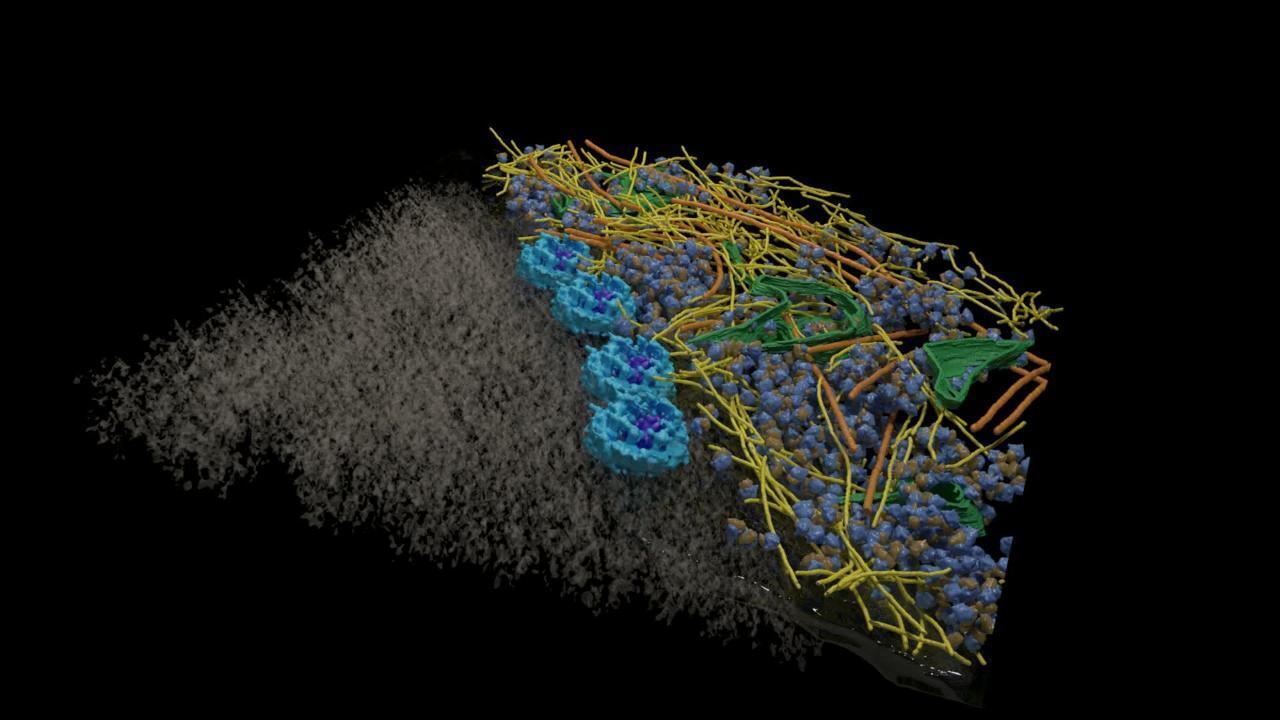
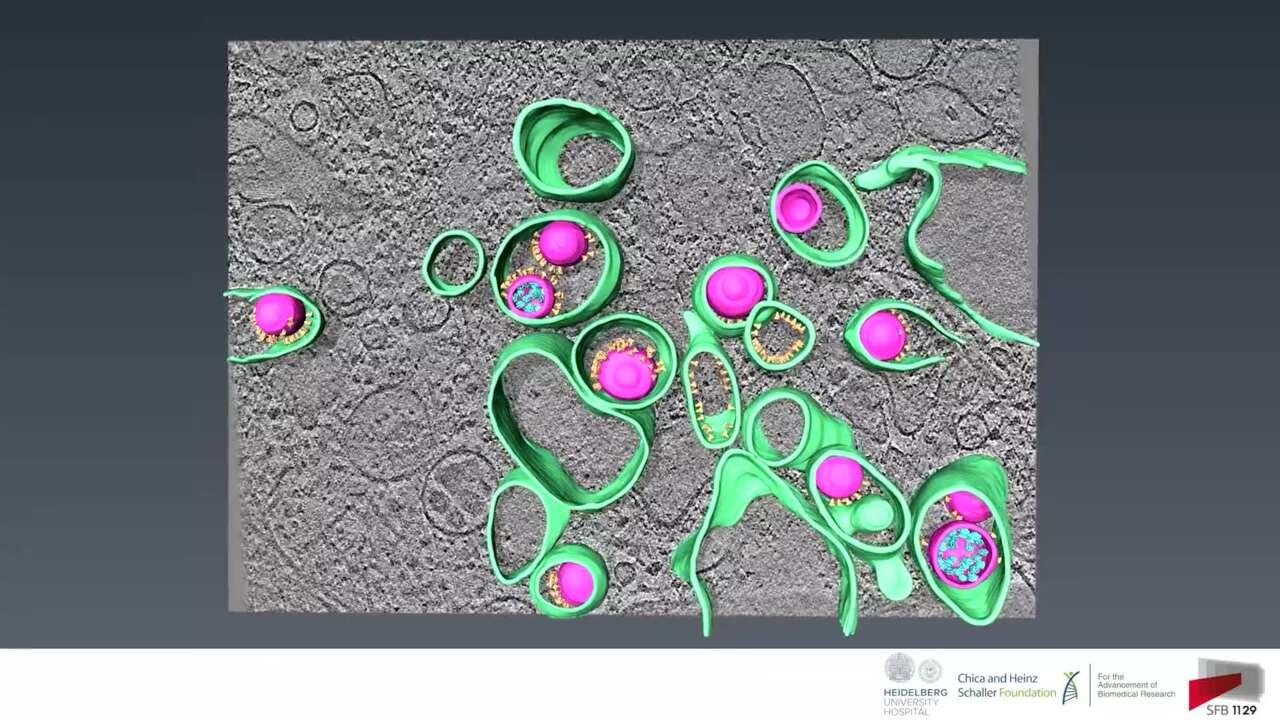
Cryo-tomography has been used to obtain ultra-structures of organelles and to visualize entire viruses, organisms, large protein complexes, and membrane proteins. Below images show the diversity and level of details that cryo-ET has helped reveal and visualize.

Cell organelles and macrostructures

Excitatory synapse of hippocampal neuron

Post-synaptic structure-like PSD filaments and glutamate receptors are clearly depicted as well as pre-synaptic structures such as vesicles or adhesion proteins.  Courtesy of Guoqiang Bi oand Hong Zhou of UCLA.

Data segmentation and visualization by Thermo Scientific Amira Software.

Neuronal aggregates

In neurons, ALS/FTD poly-Gly-Ala peptides aggregate into a dense network of twisted ribbons. The ribbons sequester a large fraction of the cells’ proteasomes. Courtesy of Q. Guo, Max Planck Institute - Martensreid.

Data segmentation and visualization by Thermo Scientific Amira Software.

Chlamydomonas cell

In situ tomogram of Chlamydomonas cell. Data courtesy of S. Khavnekar, W. Wietrzynski, P. S. Erdmann, MPI-Martinsried.

Data segmentation and visualization by Thermo Scientific Amira Software.

Murine neuronal cell

Reconstructed tomogram of a synapse in a murine neuronal cell prepared by xenon plasma-ion milling and cryo-FIB tomography. Sample courtesy of MRC-LMB.

Data segmentation and visualization by Thermo Scientific Amira Software.

Endoplasmic reticulum

Cryo-electron tomography reveals a phase-separated protein degradation microcompartment where proteasomes (red) cluster at the endoplasmic reticulum membrane. Data courtesy of Benjamin Engel, Biozentrum, University of Basel.

Data segmentation and visualization by Thermo Scientific Amira Software.

Virus research using cryo-electron tomography

HIV capsid

Insights into HIV in unprecedented resolution: The green and red CA protein structures form the conical protective envelope of the virus genome. Courtesy of Simone Mattei, EMBL.

Data segmentation and visualization by Thermo Scientific Amira Software.

Poliovirus replication

Tomogram 3D visualization of a poliovirus-infected HeLa cell. Empty capsids: pink, RNA-filled capsids: red, protein complexes tethering capsids to membrane: yellow, intraluminal densities: orange, and dense granules co-packaged with virions: blue. Image courtesy of Selma Dahmane, Umeå University.

Data segmentation and visualization by Thermo Scientific Amira Software.

SARS-CoV-2 Virus

Molecular architecture of the SARS-CoV-2 virus imaged by cryo-electron tomography. Courtesy of Sai Li, Tsinghua University.

Data segmentation and visualization by Thermo Scientific Amira Software.