Online and downloadable materials for NanoDrop spectrophotometers

The manuals, brochures, application and technical notes, videos, webinars, and other resources in this section will help you get the most out of your Thermo Scientific NanoDrop One/OneC, Eight, or Lite Plus spectrophotometer, or 3300 fluorospectrometer.


For similar materials for NanoDrop 2000/2000c, 8000, Lite, and 1000 spectrophotometers, see Resources for discontinued NanoDrop instruments at the bottom of this page.


NanoDrop products selection guide

Trusted by scientists worldwide, Thermo Scientific NanoDrop instruments set the standard for microvolume analysis, delivering accurate nucleic acid and protein sample concentration as well as sample purity information.

Using the NanoDrop One to quantify protein and peptide preparations at 205 nm

Life scientists can quantify peptide and protein samples on the Thermo Scientific NanoDrop One/Oneᶜ Microvolume UV-Vis Spectrophotometer using the A205 preprogrammed direct absorbance application.

Frequently Asked Questions: NanoDrop One sample contaminant identification

The Thermo Scientific NanoDrop One Microvolume UV-Vis Spectrophotometer is designed to help research scientists achieve success in downstream applications by accurately quantifying DNA, RNA, and protein samples using only 1–2 µL.

UV-Vis solutions in Biopharma and Biosciences

Hear about the latest applications and advancements for UV-Vis spectrophotometry in biopharma and biosciences research. Free registration lets you access all five sessions.

Simple, easy, and fast nucleic acid and protein quantification

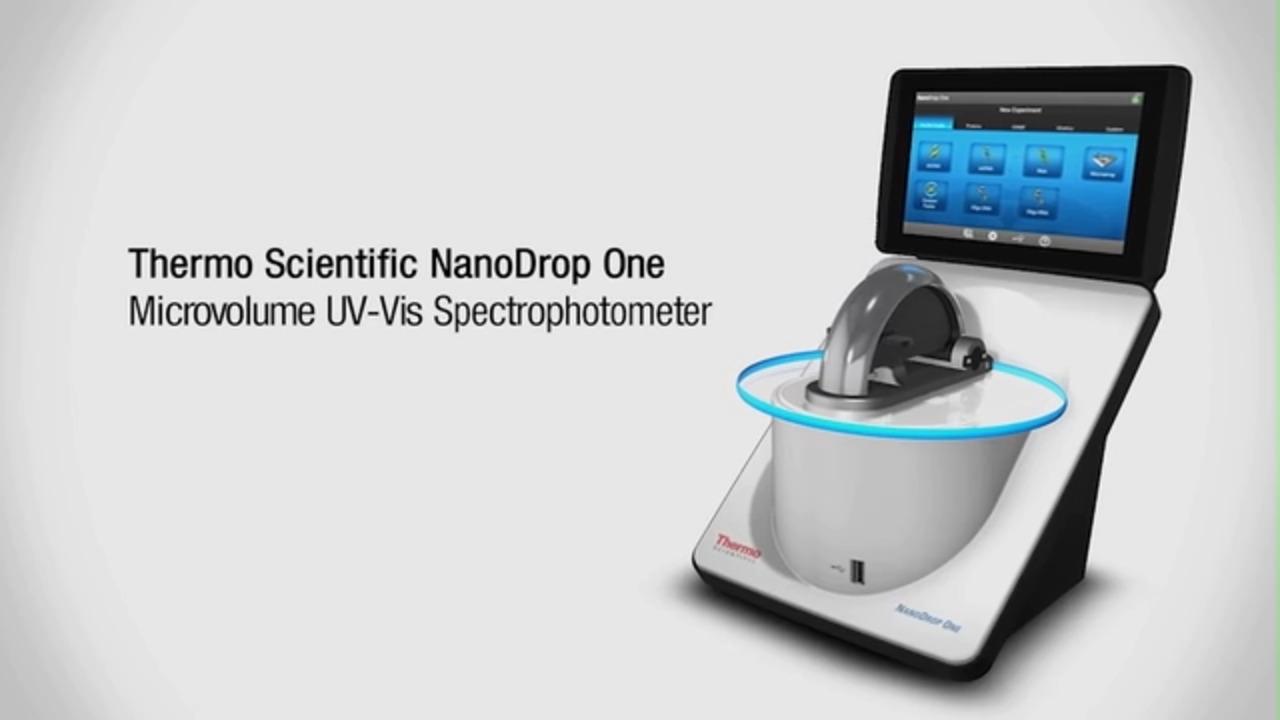
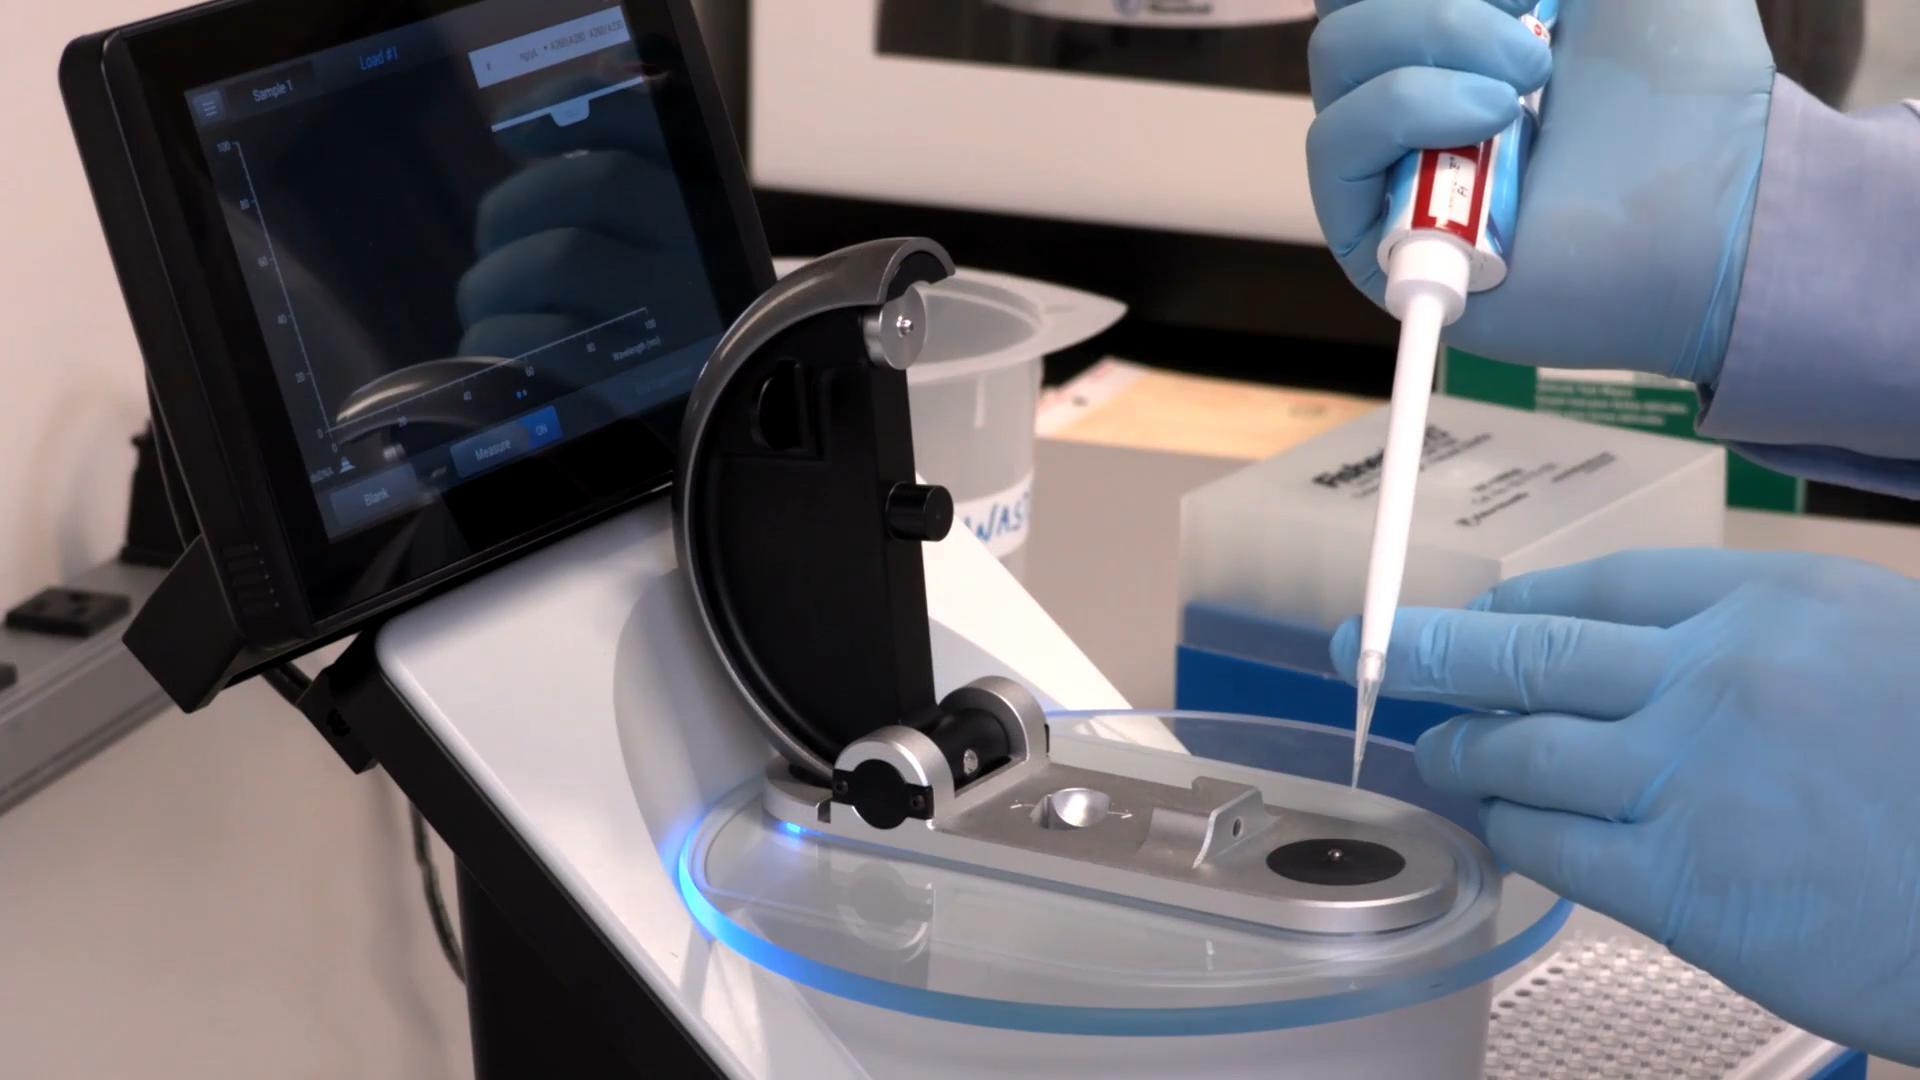
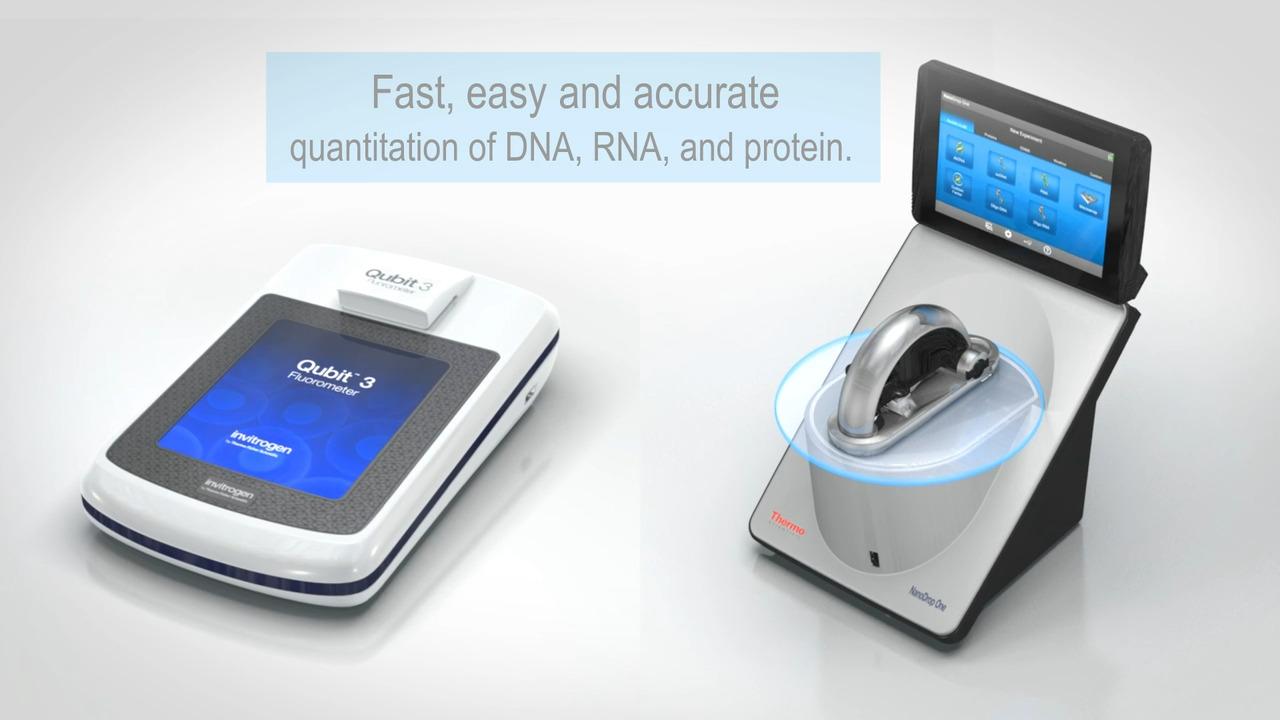
Perhaps the most striking feature of NanoDrop quantitation is how simple and easy it is to use. The pioneering NanoDrop pedestal system helps minimize sample volume and simplifies operation. Simply pipet a drop of your DNA, RNA, or protein sample—as little as 1.0–2.0 µL—on the pedestal and pull down the arm. No cuvettes or capillaries are needed and the results appear in seconds.

1. Open the arm and pipet the sample directly onto the pedestal.

2. Close the arm. A sample column is formed.

3. The pedestal moves to automatically adjust for an optimal path length.

4. When the measurement is complete, simply wipe the surfaces with a lint-free lab wipe before continuing with the next sample.


Accurate nucleic acid and protein quantification via UV absorbance

NanoDrop spectrophotometers work on the principle of ultraviolet-visible spectrum (UV-Vis) absorbance. Nucleic acids absorb light with a peak at 260 nm. Purified proteins absorb light at a peak of 280 nm, while peptides and proteins that lack tryptophan and tyrosine residues absorb at a peak of 205 nm. Many contaminants left over from extraction protocols absorb at either 280 nm or 230 nm.

Generation of optical signal

The photometric measurement of nucleic acids (DNA and RNA) and proteins is based on their intrinsic absorptive properties. When an absorption spectrum is measured, nucleic acids absorb light with a characteristic peak at 260 nm.

Quantitation of nucleic acids and protein samples

Concentrations of nucleic acids and proteins are calculated automatically from their measured absorbance values at the desired wavelength using the Beer-Lambert equation, where:

  • c = concentration in molar (M)
  • A = UV absorbance in absorbance units (AU)
  • e = wavelength-dependent molar absorptivity coefficient (or extinction coefficient) in M-1cm-1
  • L = light path length in cm

One implication of the Beer-Lambert equation is that for low-concentration samples, a longer path length results in greater accuracy and signal-to-noise ratio. NanoDrop instruments automatically optimize the length of the liquid column for maximum accuracy across a wide concentration range.

Accuracy of NanoDrop One dsDNA quantitation validated against a reference instrument. A series of dsDNA dilutions was prepared ranging from 3–28,000 ng/µL and quantitated spectrophotometrically at 260 nm on the NanoDrop One and Evolution 300 spectrophotometers. (A) A linearity comparison across the entire instrument concentration range was plotted. The regression line demonstrates that the NanoDrop One dsDNA concentration results were well aligned (R2 = 0.9991) with the values obtained on the reference Thermo Scientific Evolution 300 Spectrophotometer. (B) A closer look at the linearity comparisons at the low concentration range (from 3–495 ng/μL) was also plotted. The regression line shows a close correlation (R2 = 1) to the Evolution 300 results and superb linearity at the lower end of the detection range. For method and more detailed data, see the NanoDrop One nucleic acid technical note.

Purity analysis for nucleic acid and protein samples

Purity of a sample can be assessed using ratios of absorbance of one wavelength to another. Sample contamination may result in overestimation of the nucleic acid concentration and/or inaccuracies in downstream processes or measurements.


Key purity ratios for UV absorbance

Ratio

Analyte

Considered “pure”

Factors that can cause abnormal ratios

A260/A280

Nucleic acids

DNA: ~1.8
RNA: ~2.0

Contaminants indicated by low ratios:

·    Proteins

·    Residual phenol or other reagents used in extraction protocol

A260/A230

Nucleic acids

DNA/RNA: ~2.0­–2.2

Contaminants indicated by low ratios:

·    Proteins

·    Carbohydrate carryover (often a problem with plants)

·    Residual phenol from nucleic acid extraction

·    Residual guanidine (often used in column-based kits)

·    Glycogen used for precipitation

Factors indicated by high ratios:

·    Problems with Blank measurement

A260/A280

Proteins

~0.6

Contaminants indicated by high ratios:

·    Nucleic acids

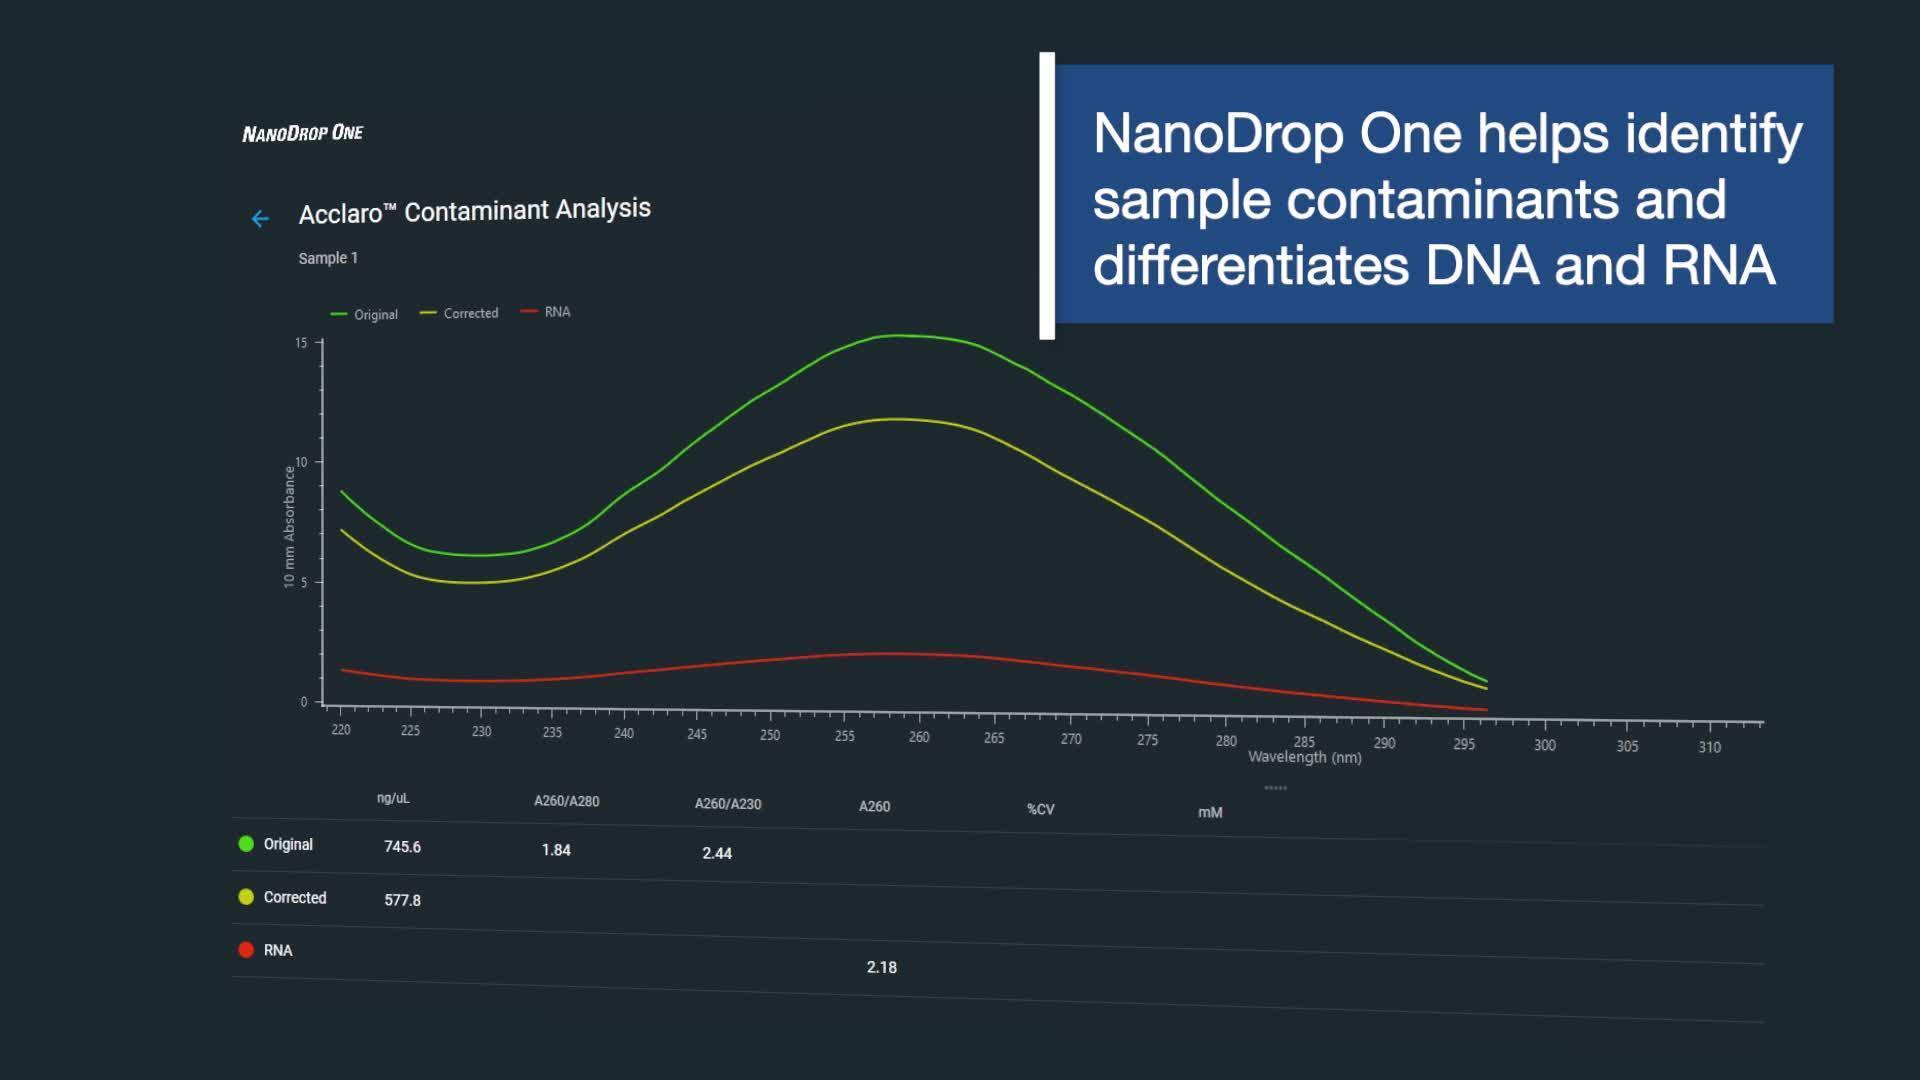
Beyond purity ratios, impurities can alter spectral profiles, shifting peaks and troughs as shown in the figure.

Contaminants cause shifts in spectral profiles

Spectra of purified DNA without contamination (A, red) and of the same sample contaminated with guanidine (B, green) and phenol (C, brown).

NanoDrop instruments that run Acclaro Sample Intelligence software can use this kind of whole-spectrum data to identify contaminants, as described in Features.


Documents for the NanoDrop One/Oneᶜ Spectrophotometer


NanoDrop spectrophotometer videos


NanoDrop spectrophotometer webinars

Webinar: Versatile solutions for human leukocyte antigen (HLA) testing with peripheral blood

Watch this webinar to gain a broad understanding of the HLA assay technique, how high-quality DNA positively impacts the typing process, and the importance of quality checks as executed with NanoDrop Microvolume UV-Vis Spectrophotometers on the NGS workflow.

Webinar: Protein sample evaluation using the NanoDrop One UV-Vis Spectrophotometer

Protein sample evaluation is an important step in many protein workflows. This webinar explains how NanoDrop instruments streamline the process, compares the different protein assays available, and reviews best practices for accurate protein quantification.

Webinar: mRNA vaccines: development, manufacturing, and how NanoDrop Eight can help

This webinar briefly discusses mRNA vaccine history and workflows and examines how NanoDrop spectrophotometers can aid researchers and production engineers in assessing nucleic acid concentration and purity while complying with 21 CFR Part 11 regulations.

Webinar: Maintaining compliance in pharma QA/QC labs

Learn how new software tools are enabling drug companies to perform highly accurate QA testing, while ensuring data integrity throughout the drug development process.

Webinar: NanoDrop innovations and the classroom: Inspiring the next generation of scientists

Access to the latest technology can make a world of difference in education today. Hear how schoolteachers are integrating NanoDrop instruments into their classrooms and labs, providing students with the opportunity to learn on industry-leading technology.

Webinar: Quantifying Soy DNA Extracts for Downstream GMO Detection

This webinar will provide an overview of GMO detection via qPCR and highlight the NanoDrop Eight Spectrophotometer in ensuring a successful reaction.

Webinar: Next-generation sequencing sample preparation using the NanoDrop One Microvolume UV-Vis Spectrophotometer

Watch and learn how the NanoDrop One/Oneᶜ Spectrophotometer, can efficiently and effectively analyze qPCR data for high-quality sequencing.

Support and educational resources for NanoDrop spectrophotometers

For technical support in the United States and Canada, please call 877-724-7690, option 4 or email NanoDrop technical support at nanodrop@thermofisher.com. For international assistance, please email nanodrop@thermofisher.com or contact your local NanoDrop distributor.


Many technical support questions can be answered by consulting the documentation, literature, videos, and webinars above. In addition, our free online educational materials include these Learning Centers and pages covering spectroscopy, protein biology, and nucleic acid quantification.


Spectroscopy, Elemental, & Isotope Analysis Learning Center

Understand more about the technologies that offer rapid and efficient qualitative and quantitative analyses for a range of industrial, educational, environmental, and health markets. Plus, access resources to support academic presentations with NanoDrop One educational animations and inspire the next generation of scientists with this complimentary Spectroscopy Techniques poster.

Protein Biology Learning Center

Our free introduction to protein analysis methods and technologies includes articles, videos, guided learning, and more resources on proteins and ways to study them. Its Overview of protein assays methods might be a good place to start.

RNA/DNA quantification page

Our RNA/DNA quantification page contrasts UV-Vis photometry with fluorescence as approaches for quantitating nucleic acids, and compares NanoDrop and Qubit instruments and plate readers for making both kinds of measurements.

Resources for discontinued NanoDrop instruments

Find manuals, brochures, application and technical notes, videos, and other resources to help you get the most out of your NanoDrop 2000/2000c, 8000, Lite, or 1000 spectrophotometer.

Resources for the NanoDrop 1000 Spectrophotometer

Resources for the NanoDrop 2000/2000c Spectrophotometer

Resources for the NanoDrop 3300 Spectrophotometer

Resources for the NanoDrop 8000 Spectrophotometer

Resources for the NanoDrop Lite Spectrophotometer