Search Thermo Fisher Scientific
- Order Status
- Quick Order
-
Don't have an account ? Create Account
Search Thermo Fisher Scientific

When you understand the quantity and purity of your samples, you can make educated decisions about using them in downstream experiments. The Thermo Scientific NanoDrop spectrophotometer family helps you quickly assess whether your sample contains what you intended in appropriate amounts. Depending on the instrument you choose, the software also can alert you when contaminants are present and identify what they are.
Nucleic acid and protein quantification and purity assessment, the core functions of NanoDrop spectrophotometers, are indispensable for many downstream applications, notably RT-qPCR and quality control. Applications such as bacterial culture growth, kinetics, and chemometric applications such as QC of liquid polymers are also supported. On our premier models, you can also create and share custom methods or download them from our website.
Nucleic acids have traditionally been quantified by determining the UV absorbance at three analytical wavelengths: 230 nm, 260 nm, and 280 nm. These absorbance measurements allow scientists to measure nucleic acid concentration and have an indication of sample purity. The intensity of their maximum absorbance peak at 260 nm is proportional to nucleic acid concentration.
The advantages of this nucleic acid quantitation method are that it is simple, direct, and consumes only a small volume of your sample. One challenge, however, is its lack of specificity, as any contaminant that absorbs at these wavelengths will lead to inaccuracies in the resultant nucleic acid concentration.
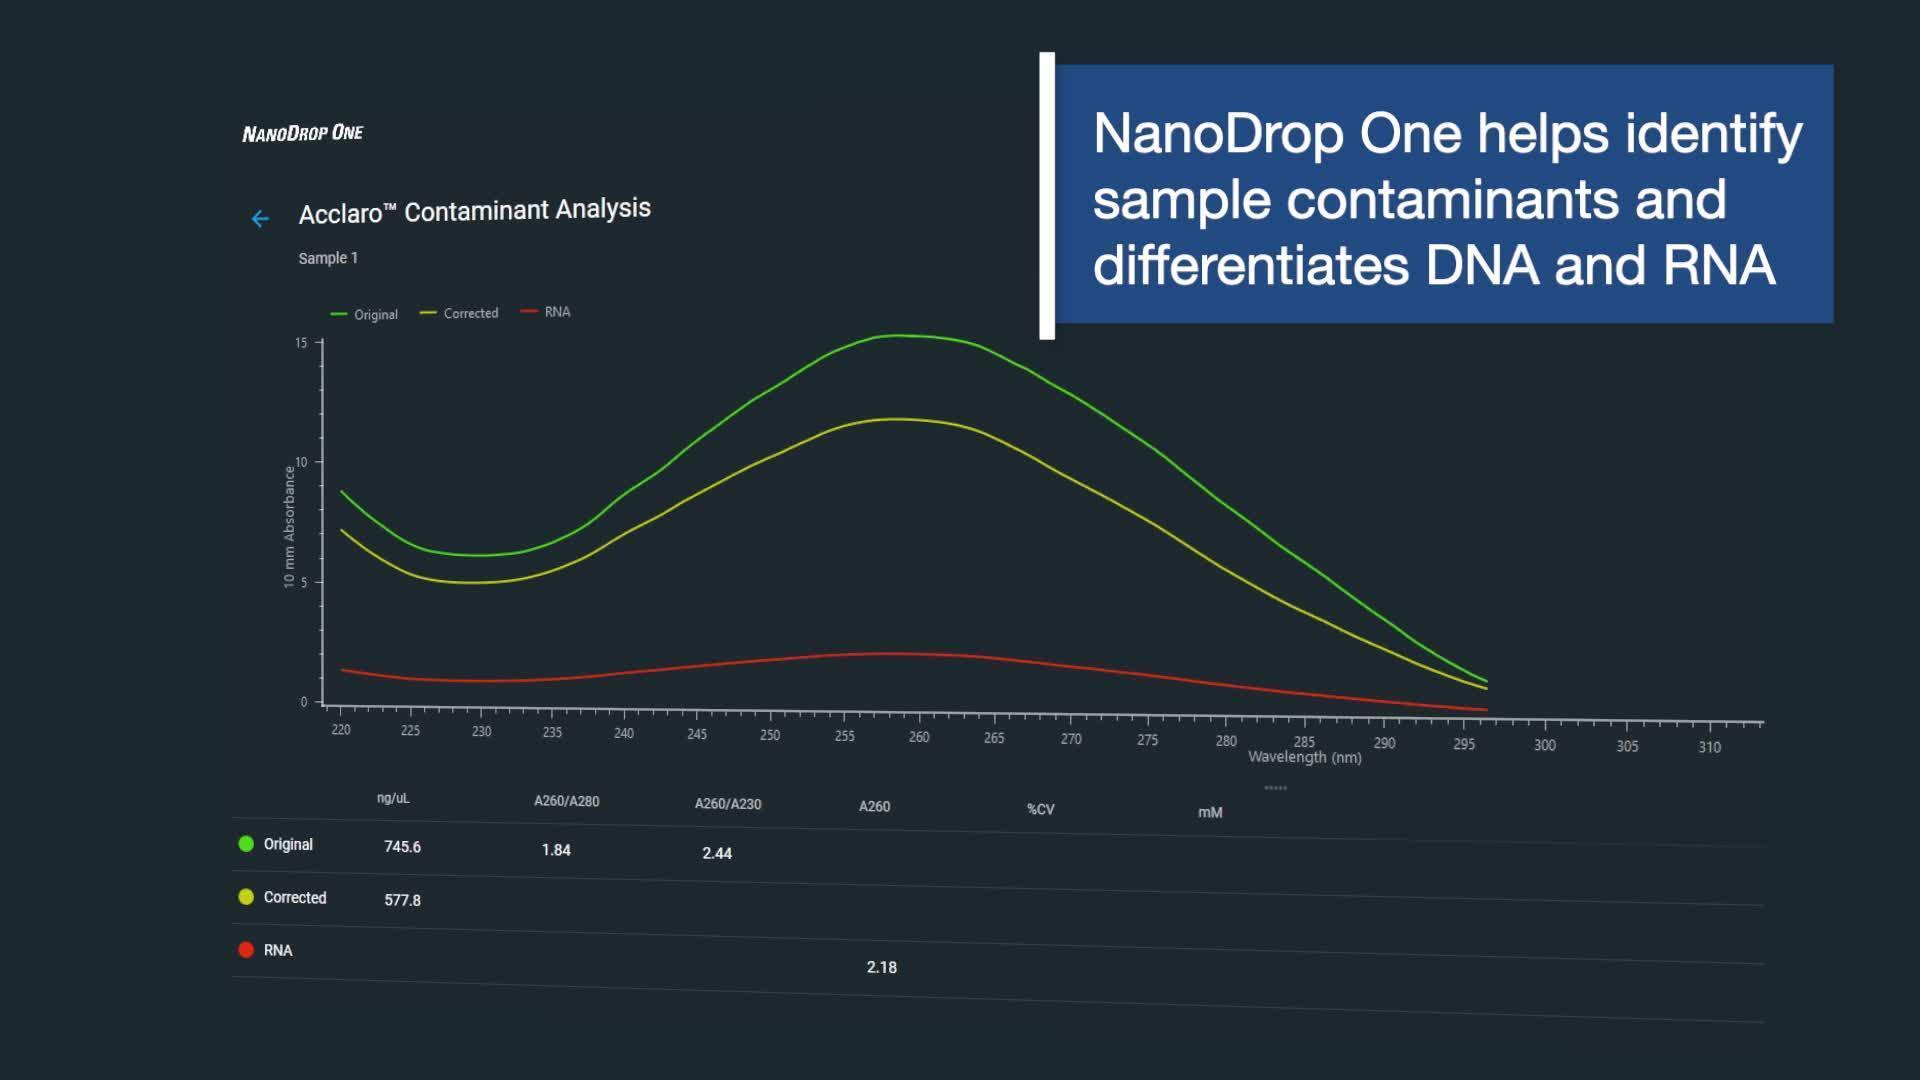
With advances in UV-Vis software, researchers can now selectively quantify nucleic acid absorbance in the presence of chemical and nucleic acid contaminants. Thermo Scientific Acclaro Intelligence Technology software (standard in our premier NanoDrop One/OneC and NanoDrop Eight spectrophotometers) uses full-spectrum data and advanced algorithms to identify common nucleic acid contaminants and provide corrected nucleic acid concentrations. Acclaro algorithms can detect dsDNA contamination in RNA and RNA contamination in dsDNA. You can also input custom oligo sequences and the software will automatically calculate the factor to apply for nucleic acid quantification.
Fluorescently labeled nucleic acids can be quantified using the Microarray preconfigured software method that delivers the nucleic acid as well as the label concentration (up to two dyes). This method is available as a preconfigured application on NanoDrop One/OneC and NanoDrop Eight instruments.
Acclaro Sample Intelligence Technology allows the NanoDrop One/OneC and NanoDrop Eight Microvolume Spectrophotometers to provide more information about sample quality by identifying common contaminants and delivering true sample concentrations. Acclaro software incorporates algorithms that rely on a reference library of spectra. The software applies these algorithms to the sample spectrum and makes predictions about the sample's contaminants by using chemometric mathematical principles.

The Acclaro reference libraries currently support detection of protein, phenol, guanidine HCl, and RNA in dsDNA samples. They also support detection of protein, phenol, guanidine isothiocyanate, and dsDNA in RNA samples. Finally, they allow detection of DNA in protein samples. Additional contaminants will be added to the libraries in the future.
Contaminant identification gives researchers two important pieces of information. First, it identifies specific contaminants that are likely to be present in the sample. This information can help scientists troubleshoot difficult extractions or purifications and make decisions regarding sample use in downstream experiments. Second, it provides a corrected concentration of the analyte. When setting up downstream reactions such as PCR where DNA concentration is a critical parameter, the corrected concentration will help scientists ensure the success of downstream experiments.
For example, RNA contamination in genomic DNA preparations is a common issue in molecular biology workflows. In traditional spectrophotometry, the presence of copurified RNA can artificially inflate the concentration of DNA. By using the full spectral data and multivariate mathematical algorithms available in the Acclaro software, researchers can identify RNA contamination in a DNA sample and see the corrected DNA concentration results.
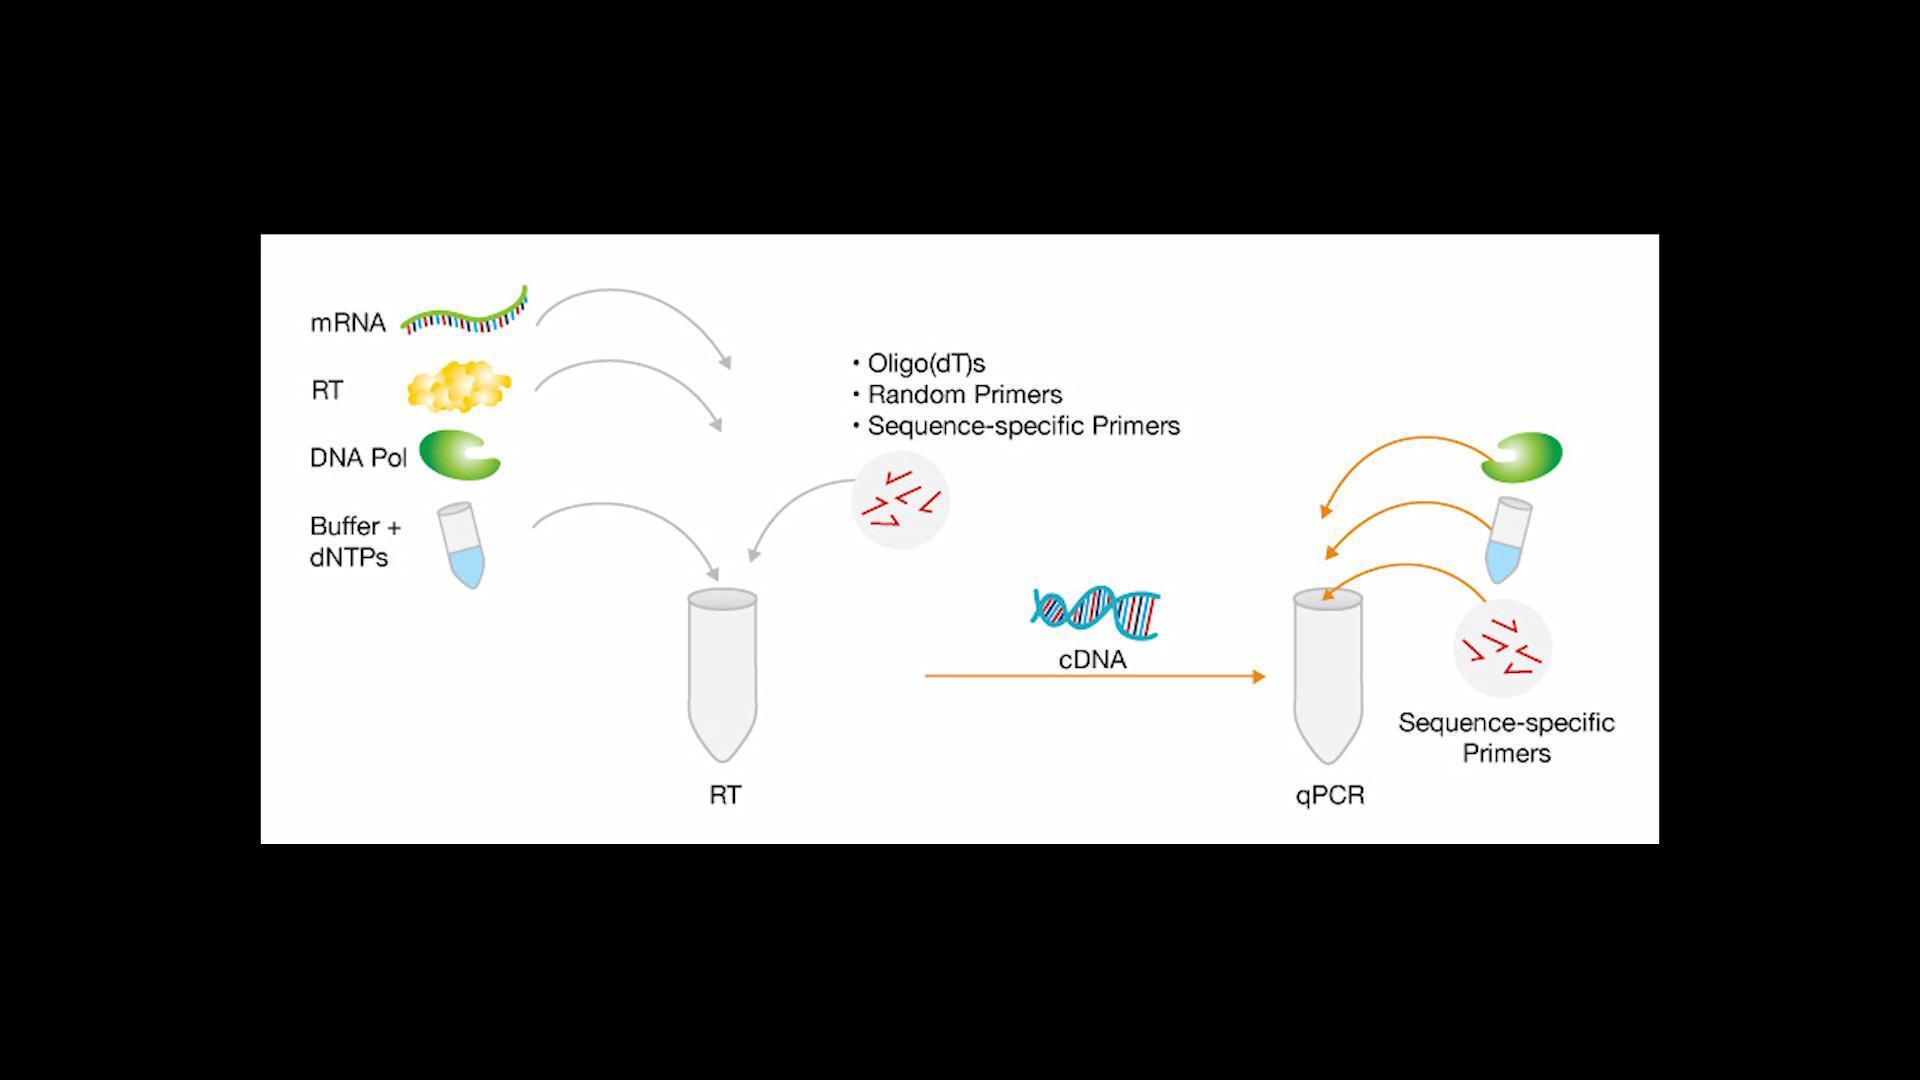
Reliable RT-qPCR (quantitative reverse transcription PCR) assays demand careful experimental design, extensive quality control (QC), and transparent data analysis.
Nucleic acid quantification is critical in both enzymatic steps of the RT-qPCR process. In the reverse transcription step, knowing (and normalizing) the amount of RNA going into the reaction helps minimize variability in cDNA production. In the PCR step, you must be certain you have enough cDNA template to determine the genotype of the sample.
The MIQE guidelines—minimum information for publication of quantitative real-time PCR experiments—require that input RNA quantity and purity are reported in publications that use qPCR.
The NanoDrop One and NanoDrop Eight spectrophotometers are well suited to quantify and qualify nucleic acid samples as a quality control step for downstream RT-qPCR assays. These instruments can help prevent failed or unpublishable experiments by providing accurate nucleic acid concentrations and identifying contaminants that may alter experimental results.
Acclaro Sample Intelligence Technology, built into both the NanoDrop One and Eight instruments, identifies the presence of common contaminants in samples and calculates an approximate concentration of the contaminant. Common molecules found in nucleic acid extraction kits can overestimate analyte concentrations or denature qPCR polymerases. In either case, the qPCR experiment can fail. The Acclaro software provides corrected nucleic acid concentrations and identifies contaminants, to help minimize time spent troubleshooting and managing failed experiments.
Scientists can use NanoDrop instruments to quantify the protein content in their sample using either direct or indirect measurements. NanoDrop UV-Vis spectrophotometers support protein sample quantification with applications for direct A280 and A205 measurements in the ultraviolet range and colorimetric assays in the visible range of the spectrum.
Protein A280 is a direct measurement application that calculates protein concentration based directly on the sample absorbance at 280 or 205 nm and the protein-specific extinction coefficient. Direct measurements are a popular choice for researchers because they are simple to perform, require no reagents or standards, and consume very little sample. Proteins, unlike nucleic acids, can exhibit considerable diversity. The Protein A280 application is appropriate for purified proteins that contain residues of tryptophan (Trp) or tyrosine (Tyr) cysteine disulfide bonds (Cys-Cys) and exhibit absorbance at 280 nm.
Colorimetric assays such as BCA, Bradford, Lowry, and Pierce 660 nm, are indirect measurement applications that rely on the generation of a standard curve and a reaction that produces a color change proportional to the amount of protein in the sample. Proteins in complex mixtures such as cell extracts or lysates are best measured using a protein colorimetric assay.
The tables below show ranges, descriptions, and considerations for protein quantification methods available on NanoDrop UV-Vis spectrophotometers, along with which methods are provided on which instruments. For more information on some of these assays, see our protein assay selection guide.
Method |
Concentration range for NanoDrop One/OneC |
Description |
Considerations |
|---|---|---|---|
A280 |
|
|
|
A205 |
|
|
|
Pierce 660 |
|
|
|
Bradford |
|
|
|
BCA |
|
|
|
Lowry |
|
|
|
Method |
NanoDrop One/OneC |
NanoDrop Eight |
NanoDrop Lite Plus |
|---|---|---|---|
A280 |
|
|
|
A205 |
|
|
No |
Pierce 660 |
|
No |
|
Bradford |
|
|
No |
BCA |
|
|
No |
Lowry |
|
|
No |
A260/A280 |
|
|
|
Acclaro Contaminant Identification |
|
|
No |
Customizable protein editor |
|
|
No |
Purified protein samples can be accurately measured using direct absorbance at 280 nm, which is mostly due to the aromatic chains on the Trp and Tyr amino acids. Protein A280, a preconfigured application in our software, is the most popular quantification method because it is fast and simple, requires no reagents or standard curves, and consumes very little sample.
Unlike nucleic acids, each pure protein has a unique Beer-Lambert extinction coefficient based on its amino acid sequence. For accurate results, select the correct sample type from the menu or enter its protein extinction coefficient manually. The NanoDrop One and NanoDrop Eight Protein Editor feature allows you to save the extinction coefficients of specific proteins so that you can customize your Sample Type options.
In addition to concentration, NanoDrop spectrophotometers can provide information about contaminants in the sample. Acclaro Sample Intelligence Technology (included on the NanoDrop One/OneC and NanoDrop Eight instruments) uses mathematical algorithms to detect nucleic acids in protein samples and correct the concentration result as needed. Sample purity can also be assessed by measuring its A260/A280 ratio; a value >1 may indicate nucleic acid contamination in the protein sample.
What if your protein or peptide lacks Trp and Tyr residues and thus cannot be measured using the A280 application? Since a protein’s peptide backbone absorbs light at 190–220 nm, peptides that lack Tyr or Trp residues can be quantified using absorbance at 205 nm. Protein A205 is a preconfigured application in NanoDrop software.
Proteins that have significant amounts of Trp and Tyr can also be quantified using the A205 application by selecting the Scopes method option. In fact, the A205 method has some advantages over the A280 protein method such as lower protein-to-protein variability (because A205 extinction coefficients are not based on amino acid composition) and higher sensitivity (because of proteins’ high molar absorptivity at 205 nm). Although technical limitations made these measurements difficult in the past, NanoDrop sample-retention technology and low stray light performance have simplified quantification of small amounts of protein by A205 methods.
One limitation of the A205 method is that many commonly used protein buffers have absorbance at 205 nm. Before using this technique, we recommend checking the protein buffer for any contribution to the absorbance at 205 nm.
Proteins in complex mixtures such as cell extracts or lysates are best measured using a protein colorimetric assay such as the Bradford, BCA, Lowry, or Pierce 660nm assay. These assays provide protein-specific concentrations, avoiding absorbance from cell components that absorb in the UV range and would inflate A280. These and other applications are preconfigured on selected NanoDrop instruments.
Labeled antibodies or other fluorescently labeled proteins and metalloproteins can be quantified using the Proteins & Labels preconfigured software application that delivers the protein as well as the label concentration (up to 2 dyes). This application is available as a preconfigured application on NanoDrop One/OneC and NanoDrop Eight Spectrophotometers.
Quality assurance and quality control are more important now than ever before. In busy QC labs, NanoDrop spectrophotometers can help make the analysis of sample concentration and purity reproducible, routine, and reliable. Integrating next-generation sample quality assessment into your workflow makes a difference because time is precious and the quality of all your samples is paramount.
The mRNA vaccine against COVID-19 was the first mRNA vaccine to get FDA approval. Its success has re-ignited interest in using mRNA to deliver vaccines against a myriad of diseases including cancers. In vaccine production, quality checks of sample concentration and purity are useful at several steps in the process.
View our on-demand webinar to see how the NanoDrop One/OneC and NanoDrop Eight spectrophotometers can readily be deployed for all these tasks. And, with software available to aid compliance with FDA 21 CFR Part 11 regulations, these instruments are ready to be implemented into the mRNA vaccine workflow at a GMP laboratory.
Our trusted, premier NanoDrop One/OneC and NanoDrop Eight spectrophotometers can be used in regulated environments such as pharmaceuticals and biotechnology. These models can help you quantify and qualify DNA, RNA, and protein samples of only 1–2 µL in seconds and obtain full-spectrum data to confirm that samples are qualified for downstream applications.
In addition, optional Thermo Scientific Security Suite or Thermo Scientific SciVault software helps your lab stay compliant with US FDA data regulations every step of the way. These software modules enable regulatory compliance with part 11 of the US FDA’s Title 21 of the Code of Federal Regulations pertaining to electronic records and signatures (21 CFR Part 11).
The following sections show selected features of Security Suite software for the NanoDrop One/OneC spectrophotometer, which include user account access, audit trail capability, electronic signatures, automated data back-up, and more. SciVault software for the NanoDrop Eight instrument provides similar functionality.
Requirement: Limit system access to authorized individuals.
Feature: Administrators grant access through the Security Suite software. User account access is managed through the Windows login system.

Requirement: Signed electronic records have printed name, date and time stamp, and meaning of signature.
Feature: Experiments are signed immediately after completion. Users can revise, review, and approve experiments from the History page.

Requirement: Secure, computer-generated, time-stamped audit trails to record operator actions and entries.
Feature: The Audit Manager creates an electronic audit trail of actions such as logons, data creation, signatures, and more. Audit logs are available as needed.

The ever-changing regulatory environment faced by manufacturers in pharmaceuticals and other regulated industries can cause confusion and doubts about compliance. Instrument systems designed to meet regulatory requirements can relieve the burden on manufacturers. How do they do it? Watch our webinar on maintaining compliance in pharma QA/QC labs to see how two different instrument platforms—the Thermo Scientific Nicolet Summit FTIR Spectrometer (for raw and finished material QA/QC) and the NanoDrop One Spectrophotometer (for DNA, RNA, and protein quantification)— help labs assure compliance in their processes.
The growth of bacterial cultures can be monitored by measuring their optical density at 600 nm (OD600). Although this is a central technique in microbiology, these optical density measurements often contain very little true chemical absorbance. Instead, they are representative of the amount of light scattered away from the instrument’s detector by the bacterial suspension.
You can measure OD600 on the NanoDrop One/OneC and NanoDrop Eight spectrophotometers using the OD600 preprogrammed application. The software uses the Beer-Lambert equation and a user-entered cell number conversion factor to automatically convert the OD600 value into the number of cells per milliliter.
Note that on the NanoDrop OneC instrument, the pedestal and cuvette options will give different OD600 values. You can use a conversion factor to compare between pedestal and cuvette measurements.
On the NanoDrop OneC instrument, you can make time-based kinetic measurements on samples in cuvettes. You can designate up to three wavelengths from 190–850 nm for continuous absorbance monitoring at user-defined intervals in up to 5 stages. Cuvette measurements offer an extended lower detection limit and an optional 37°C heater and micro-stirrer.
You can create, edit, and save kinetics experiments as custom methods.
NanoDrop spectrophotometers come with pre-loaded methods for nucleic acid quantification (like dsDNA, ssDNA, and RNA) and protein quantification (like A280, BCA, and Bradford) as described in the sections above. You can also create custom methods on the NanoDrop One/OneC or NanoDrop Eight spectrophotometer to perform UV-Vis or other user-defined measurements to suit your needs, allowing the instrument to function as a conventional spectrophotometer. Custom methods can monitor and report up to 40 wavelengths from 190–850 nm and can be set up directly from the touchscreen or PC control software. Custom methods provide the flexibility to use your instrument for additional applications.
As a case example, a spectrophotometer may be used to quantitate various forms of hemoglobin using the appropriate extinction coefficient and peak absorbance value.
We created a custom method for the NanoDrop One/OneC instrument to measure the absorbance of hemoglobin at 406, 414, 431, 541, and 576 nm—the five wavelengths needed to differentiate oxyhemoglobin, deoxyhemoglobin, and methemoglobin. This result graph shows a typical absorbance spectrum for methemoglobin.
Chemometrics is the use of multivariate mathematical models and statistical techniques to determine quantitative concentration information of many components simultaneously. When used to analyze UV-Vis data from complex chemical samples (mixtures), chemometrics can provide a powerful approach to determining the concentration of chemical species that have overlapping spectra. Historically, the sophistication of its multivariate calibration models limited its use to those with deep knowledge of the field, so most data had to be transmitted to an experienced chemometrics expert for post-collection analysis.
Thermo Scientific NanoDrop QC Software brings powerful chemometric analysis to the NanoDrop OneC microvolume measurement platform. This combination is an attractive solution for a wide range of applications including petrochemical analysis, drug purity, polymer manufacturing, food dye applications, and many more applications where chemometric analysis is required.
NanoDrop QC Software simplifies and streamlines the development and deployment of chemometric methods. Scientists developing methods can collect spectra on the compounds of choice and import them into Thermo Scientific TQ Analyst Software to build the method. Methods can then be deployed directly to NanoDrop OneC UV-Vis Spectrophotometers around the world, allowing QC technicians to achieve pass/fail and other quantitative results on the factory floor.

Cuvette-based UV-Vis technology and PC-based chemometric software are staples in the quality analysis of liquids such as dyes, lubricants, and adhesives. The sample preparation and analysis of these solutions may include multiple time-consuming processes impacting the release of high-value products. Our innovative, auto-ranging pedestal UV-Vis spectrophotometer eliminates time-consuming steps such as dilution of highly concentrated samples and simplifies chemometric method development data analysis.
In our chemometrics application note, we demonstrate a step-by-step approach to create and validate a chemometric method that determines concentrations of individual azo dyes in a complex mixture. We show how NanoDrop QC Software can be used to obtain quantitative information in samples that have multiple components with highly overlapping UV-Vis spectra.
Access to real-world instrumentation is key to preparing and inspiring the next generation of scientists. Hands-on experience helps make science more approachable and scientific principles more memorable.
In particular, UV-Vis spectroscopy is a valuable tool for studying macromolecules such as proteins and nucleic acids in the biology classroom. The simplicity and affordability of NanoDrop instruments makes them highly suitable for use in undergraduate and even secondary science curricula. Experience with NanoDrop spectrophotometers can support lessons in genomics, immunology, microbial cell growth, enzyme kinetics, and the structure and function of the fundamental components of life.
This webinar documents how two high school teachers have integrated NanoDrop One Spectrophotometers into their classes and workshops.
For Research Use Only. Not for use in diagnostic procedures.
Brij is a registered trademark of UNIQEMA AMERICAS LLC. All other trademarks are the property of Thermo Fisher Scientific Inc., and its subsidiaries.


.")
