Search Thermo Fisher Scientific
- Order Status
- Quick Order
-
Don't have an account ? Create Account
Search Thermo Fisher Scientific
In battery research, development, and manufacturing, imaging techniques such as scanning electron microscopy (SEM), DualBeam (also called focused ion beam scanning electron microscopy or FIB-SEM), and transmission electron microscopy (TEM) are used primarily to study the structure and chemistry of battery materials and cells in 2D and 3D. Thermo Scientific electron microscopy solutions can capture and analyze battery images ranging from the mesoscale or macroscale down to the atomic scale, which enables battery researchers and engineers to develop safer, more efficient, more environmentally friendly batteries.

For example, 3D visualization of cathodes and anodes using a DualBeam FIB-SEM and Thermo Scientific Avizo Software allows quantitative characterization of the microstructure. Important structural characteristics like volume fraction, surface area, porosity, tortuosity, and particle size distribution can be analyzed under different conditions, such as charged vs discharged state, to help understand the correlation between battery performance and its structures. Our battery workflow, combining software and hardware solutions, can streamline and improve research and development as well as help improve material quality and yield in manufacturing.
Scanning electron microscopy (SEM) is an imaging and analysis technique used for the characterization of materials’ structure and chemistry at the microscale and nanoscale. Currently, it is widely used as an effective characterization tool among battery materials and cell manufacturers during materials R&D, quality control, and failure analysis. The materials applied to construct a battery are vastly different, ranging from separator materials that are electrically insulating and beam-sensitive to Li-metal anode samples that are electrically conductive and extremely air-sensitive. Scientists and engineers face many challenges to accurately extract structure information from different battery samples.
We offer advanced SEM imaging techniques that can meet a wide variety of needs in the battery industry, ranging from high-resolution imaging and in situ analysis to structural quantification and automated contamination analysis. Our instruments and software can help you solve challenges in battery R&D and production that require the high resolution of SEM imaging for battery characterization.

Long used across multidisciplinary sciences including materials science, semiconductor, and biological applications, DualBeam (also called focused ion beam scanning electron microscopy or FIB-SEM), can perform both 2D and 3D imaging analysis to help you understand battery structure and performance correlations. In addition to a SEM with an electron column, the ion beam column can mill below the surface to observe buried features and better understand subsurface properties. It has wide application in materials R&D and failure analysis.
We offer different DualBeam technologies to enable you to study a wide range of battery materials covering multiple length scales, from nanometer to millimeter. For example, choose from Ga+ liquid-metal ion source (LMIS), inductively coupled plasma (ICP) ion, and femto-second (fs) laser sources to cover a wide range of applications for different battery materials (Li-ion, Li-metal, solid-state) at multiple length scales.

By investigating materials at sub-nanometer or atomic levels, transmission electron microscopy (TEM) can help you accelerate the development of next-generation technologies. Thermo Scientific TEMs provide an unparalleled, high-resolution characterization solution for both air-sensitive and beam-sensitive battery materials to extract their structural and chemical information in their native electrochemical states. TEM characterization and analysis help unravel aging, failure, and other fundamental mechanisms at the sub-nanometer or atomic levels, leading to a more detailed understanding of structure-performance links and ultimately advanced batteries with higher capacities.

Avizo Software delivers advanced imaging analysis that transforms EM and CT images into data, helping researchers quantitatively interpret the relationship between structure and performance. The software provides optimized workflows for advanced materials characterization and quality control within a single environment. Avizo Software is universal, reliable, fully automatable, and customizable by digital analytical labs.
At the macro level, Avizo Software can be used to assess the quality of the battery manufacturing process by allowing you to look into packaging, check solder points, and detect possible leakage or porosity and delamination. You can also examine the aging process, look into foil, cathode, and anode morphological changes or core leakage.
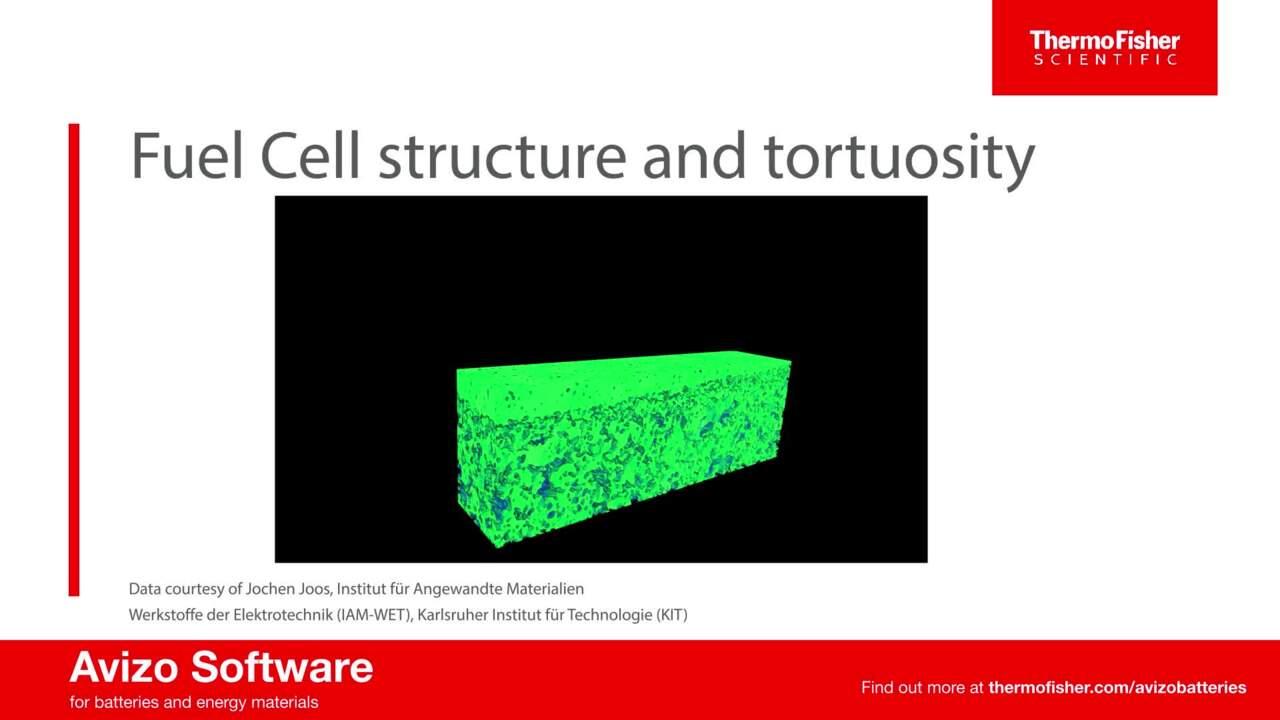
At the microscopic level, Avizo Software allows for the estimation of the tortuosity and permeability of the porosity structure of electrode and separator, allowing effective transport parameters to be used in the electrochemical performance simulation. Quantification of triple phase boundary, phase distribution, and connectivity further allow for characterization of the cell’s performance.
The cathode is the most expensive component within the battery, accounting for roughly 40% of the overall cell cost. Therefore, the quality of these cathode particles, such as particle size distribution of both primary and secondary particles, must be strictly monitored during the production process. Scanning electron microscopy (SEM) can identify quality fluctuations in raw materials as well as their intermediate products by providing intuitive morphological results with statistics, which play an essential role in cathode particle quality control during the manufacturing process.


Polycrystalline Li(NixCoyMnz)O2 cathode particles with different primary crystal sizes.
The Thermo Scientific Phenom XL G2 Desktop SEM provides an easy-to-learn interface, high-quality imaging, and accurate and reproducible results that enable high-throughput quality control in cathode production. Its compact size is suitable for most QC labs, and its automated imaging workflow can further enhance throughput and productivity. Thermo Scientific ParticleMetric Software allows visualization and analysis of SEM images, turning imagery into quantitative data such as particle size and aspect ratio.

The separator plays a key role in preventing physical contact between electrodes and enabling ion transport. To help assess separator quality and performance, SEM provides microstructural information like porosity, pore morphology, and contaminants distribution of the separator at the nanoscale. However, due to the separator’s intrinsically poor thermal conductivity, electronic conductivity, and beam sensitivity, characterizing a separator sample without damage is challenging. The Thermo Scientific Apreo 2 SEM offers ways of optimizing imaging conditions, such as superior low-energy imaging, to resolve this challenge.
Once the SEM image of the separator sample is collected, quantitative analysis can reveal important structural characteristics related to pores and polymers.

2D pore size distribution analysis
A wet-processing separator sample was imaged on the Apreo 2 SEM and quantitatively analyzed using a preset workflow with Avizo2D Software. The figure shows analysis of the pore structure and size distribution, enabling a quantitative understanding of this separator property.
Besides characterizing the separator surface morphology, the cross-section of the separator is also essential for understanding the separator structure. DualBeam instruments can quickly open access to the separator cross-section, but due to the sensitive nature of the polymer sample, milling processes at room temperature will result in severe damage to the polymer separator. Cryo-FIB milling is required.
The Thermo Scientific Scios 2 DualBeam Microscope with Thermo Scientific Cryo-stage offers cross-section preparation for temperature-sensitive samples. In this example, a separator coated with a ceramic layer was milled and imaged at a variety of temperatures. The best image quality was observed when the characterization was conducted at –80°C.

FIB cross-section preparation at different temperatures. (A, D) room temperature; (B, E) –80°C; (C, F) –180°C.


Battery electrodes (anodes and cathodes) generally consist of active materials, a binder, and conductive carbon. Understanding important characteristics within an electrode—such as how different phases are distributed to construct it, particle cracking, porosity, pore connectivity, and tortuosity—can facilitate correlation analysis between electrode structure and final cell performance.
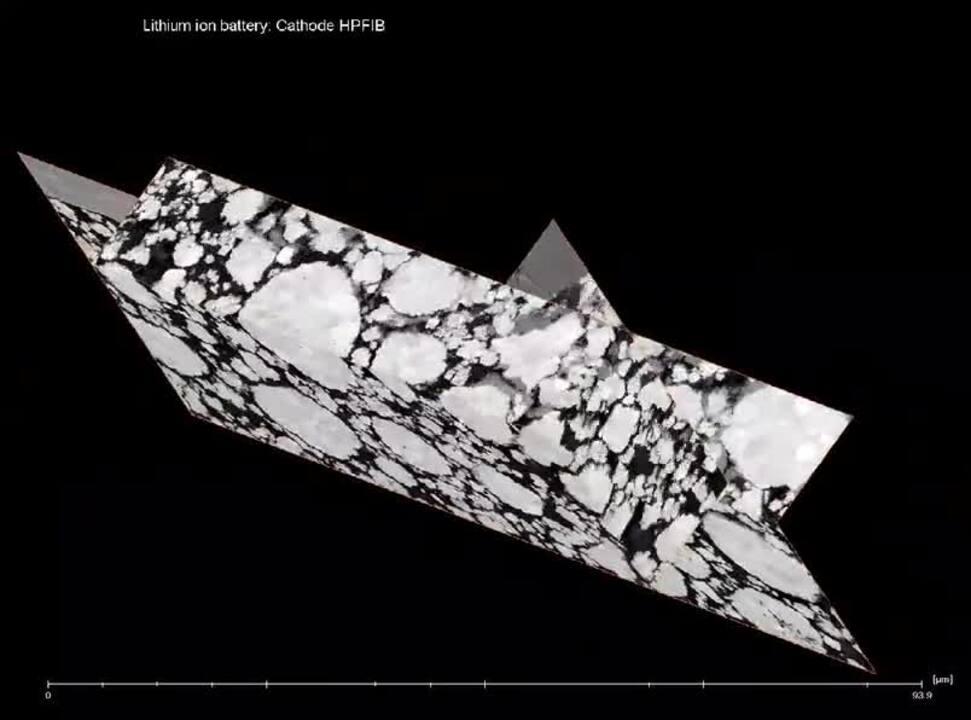
2D cross-sectional analysis is an effective approach to characterize the electrode structure for both battery R&D and failure analysis purposes. With the Thermo Scientific Helios 5 Hydra DualBeam, we can easily access more than a hundred micron-wide 2D cross sections of a battery electrode within an hour. In this study, 2D cross-sections of a Li(Ni0.8Mn0.1Co0.1)O2 (NMC) cathode were prepared on the Helios 5 Hydra PFIB. Images were analyzed with Avizo2D Software to detect four phases (grain, pores, carbon/binder, and cracks). The phase distribution and size distribution of particles were extracted from this NMC cathode structure and quantified for deeper understanding.

2D particle size and phase analysis of NMC cross-sections on the Helios 5 Hydra DualBeam. (A) SEM image of NMC cathode color coded to indicate different particles. (B) Particle size distribution analysis. (C) Phase volume distribution along electrode calendaring direction. Data collection courtesy of Ron Kelley, Thermo Fisher Scientific. Sample provided by Prof. Shirley Y. Meng, University of California, San Diego.
3D imaging analysis can illuminate more structural characteristics than 2D imaging, such as tortuosity and connectivity, which strongly correlate to battery transport performance. In this study, the graphite anode in a commercial Li-ion battery was analyzed in three dimensions. As a highly complex system with features spanning different scales, from particle size in the micron range to critical pore features in the nanometer range, it is challenging to characterize a large representative 3D volume in high resolution.
Using a Thermo Scientific Helios 5 Laser PFIB DualBeam Microscope to image a graphite anode with automated serial sectioning, a 3D dataset of the representative volume was collected with nanometer resolution. Avizo Software was used to quantify microstructure and extract parameters including phase volume fraction, particle size, and pore tortuosity to understand structure and performance. These structural parameters are crucial to understanding the electrode’s properties and provide insight for further performance improvement.


The solid electrolyte interface (SEI) is a critical component that forms on the electrode surface during battery cycling and controls the stability of battery performance. The SEI is extremely challenging to characterize due to its beam sensitivity and nanometer scale.
In this example, the 3D structure and chemical information of the SEI on a silicon nanowire anode were investigated via cryogenic scanning on the Thermo Scientific Talos F200X TEM with a Super-X EDS Detector. Avizo Software was used for 3D volume visualization and comparison of the SEI structure after the first and hundredth charging cycles. This analysis helped develop a physical understanding of the silicon anode degradation mechanism.1

2D and 3D elemental distributions show evolution of the SEI in silicon nanowire anode over battery cycling. Images were acquired on a TALOS F200X TEM with a Super-X EDS Detector under cryogenic conditions to preserve structural and chemical information. (Left) 2D EDS cross section and energy spectrum. (Right) 3D EDS visualization and cross sections after (Top) one charging cycle and (Bottom) 100 charging cycles. Fluorine (red) begins as a core shell structure and penetrates into the core over time. Sample courtesy of Dr. Chongmin Wang, PNNI.
1He Y, Jiang L, Chen T, et al. Progressive growth of the solid-electrolyte interphase towards the Si anode interior causes capacity fading. Nature Nanotechnol. 2021; 16: 1113-1120. Abstract

Battery imaging, from the millimeter down to the micron scale, is an invaluable tool for research and development of batteries and fuel cells. By combining techniques such as X-ray tomography, TEM, and FIB-SEM or plasma FIB (PFIB), images of the whole assembly can be obtained and observed across multiple scales.
Avizo Software provides advanced image processing and segmentation techniques to implement this multiscale approach. At the macro level, Avizo Software can be used to assess leakage, porosity, or delamination. It can also examine aging processes by monitoring the quality of the foil, cathode, and anode. At this level, images are often generated non-destructively using micro-computed tomography (microCT).
At the microscopic level, electron microscopes (EMs) can observe structural details at the nano scale, revealing the intricate details of particle connectivity and the porous network through which ions are transported. Avizo Software can analyze EM images to provide critical structural data influencing speed of charging, total capacity, and rate of capacity degradation. Effective transport parameters and the cell’s performance can be further analyzed with electrochemical performance simulations.
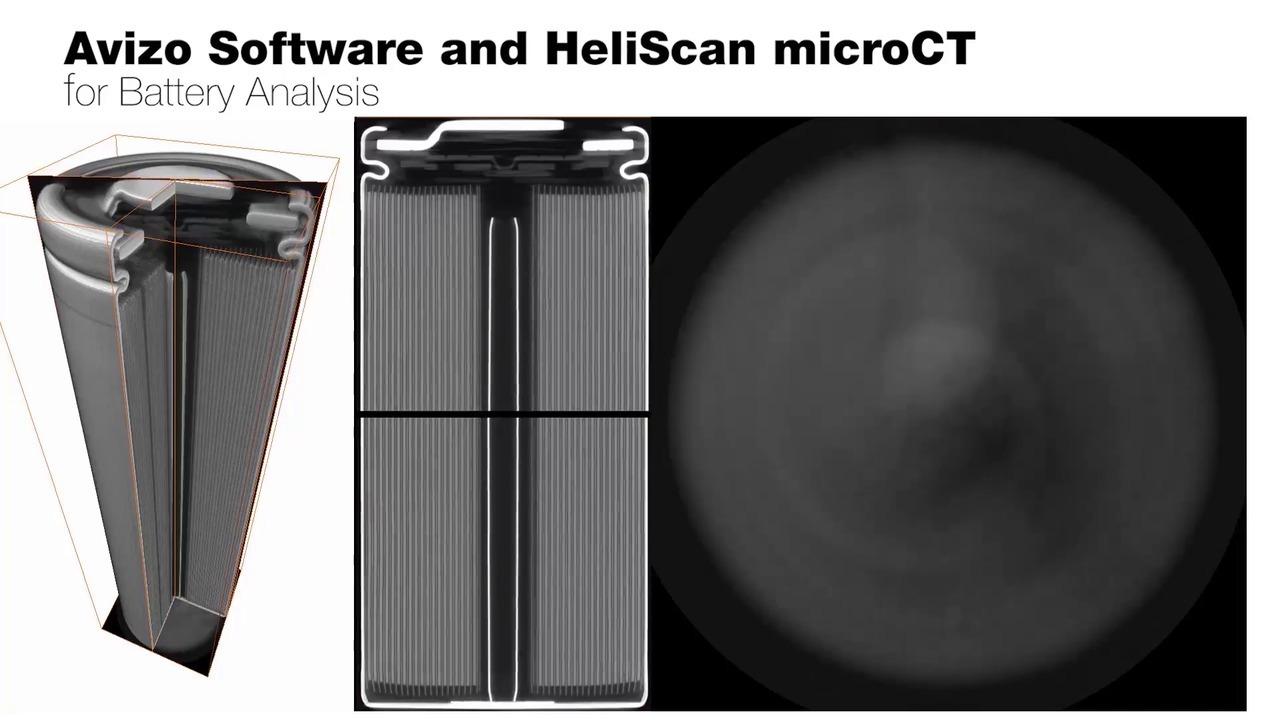
The figures illustrate three examples of Avizo Software applications for battery analysis. One example uses the software to inspect a 18650 lithium-ion cylindrical cell at macro scale to detect defects and impurities at the cell level. The other images show the evaluation of two transport properties of a separator sample: tortuosity and connectivity. Tortuosity distribution analysis is useful for evaluating the homogeneity of ion transport within the electrode, while connectivity analysis reveals how each phase within the cell is connected and how effectively the materials are utilized. Both tortuosity and phase connectivity can only be determined using 3D datasets.

Avizo Software applications for battery analysis. (A) Battery structure inspection of a lithium-ion cylindrical cell, based on data acquired by microCT. Data courtesy of Paul Shearing’s group, University College London. (B) Averaged 3D tortuosity and distribution map of a lithium-ion battery separator based on a FIB-SEM data reconstruction. Tortuosity of the battery separator relates to electrical insulation and ion transport properties and can be derived geometrically or from simulations. (C) Particle Pore Network Model shows both the particles (left) and connectivity (right) for the active material in a lithium-ion battery cathode. Based on data acquired on the Helios 5 PFIB DualBeam Microscope.
Challenge |
Technologies |
Solution |
Resources |
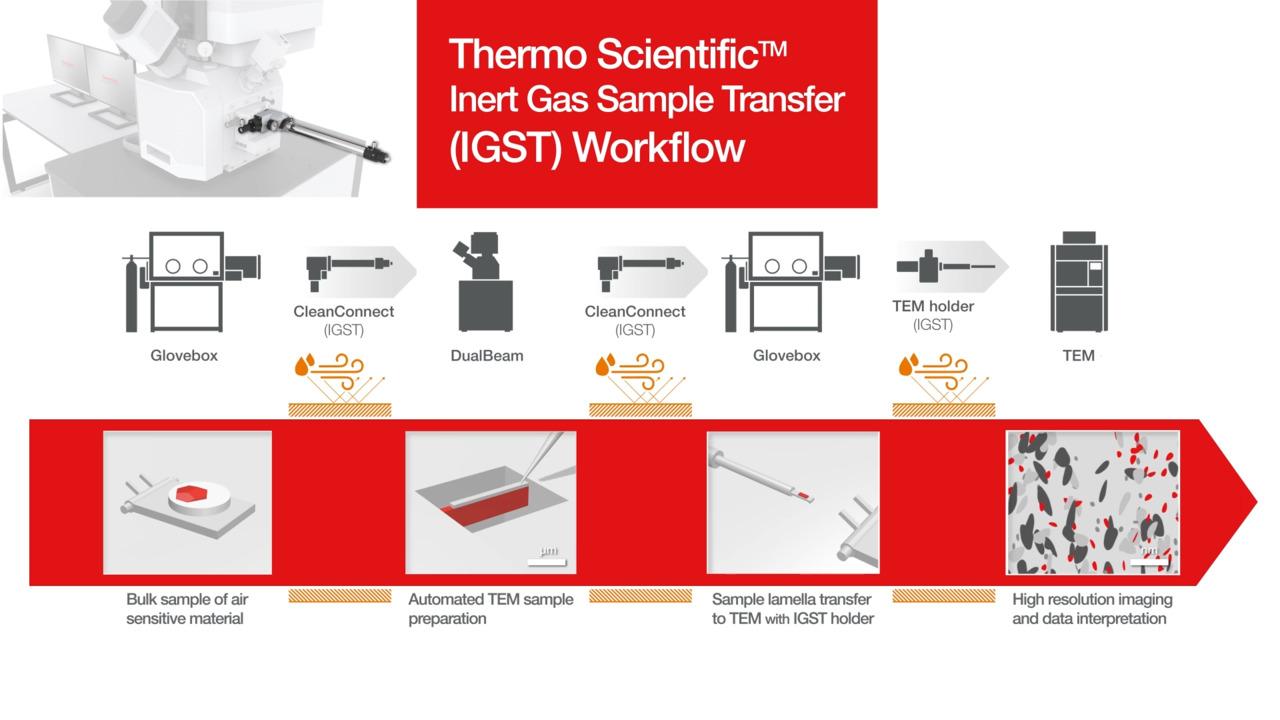
Avoid contamination of air-, moisture-, and/or beam-sensitive battery samples during preparation and sample transfer |
IGST workflow: DualBeam, SEM/Desktop SEM (in glove box), TEM, Avizo, CleanConnect |
Complete workflow to enable sample characterization of sensitive battery materials in their native state without contamination |
|
Detection of lithium is difficult using SEM, EDS, and TEM |
TOF-SIMS |
Accurately detect and map lithium in battery samples in 2D and 3D down to 10 ppm |
App note: Ion spectroscopy using TOF-SIMS on a Thermo Scientific Helios DualBeam |
TEM |
iDPC technology can clearly image light elements like lithium at atomic scale |
App note: Integrated Differential Phase Contrast on Talos S/TEM |
|
Characterize battery structure at different scales, beyond the capacity of a single instrument |
CT, SEM, Raman, DualBeam, Avizo, EDS |
Correlative workflow allowing multiscale imaging and analysis of battery microstructure |
App note: Multiscale image-based control and characterization of lithium-ion batteries |
App note: Multiscale 3D imaging solutions for Li-ion batteries |
|||
App note: Understand degradation mechanisms in lithium-ion batteries at different scales |
|||
Prepare a large 2D area on the sample surface with high polishing quality for 2D imaging and characterization |
DualBeam (Plasma FIB-SEM), EDS |
High-throughput automated spin mill with high surface quality |
App note: Large area automated sample preparation for batteries |
SEM, CleanMill |
CleanMill offers a dedicated workflow for air-sensitive samples, an ultra-high energy ion gun for fast polishing, and a cryogenic function to protect sample integrity |
||
Characterize key microstructure properties (like tortuosity) for electrode structure performance correlations |
DualBeam, EDS, TOF-SIMS, Avizo |
3D characterization of battery structure · Hardware to image 3D battery structure at different scales · Software to automate 3D imaging data collection · Avizo Software workflow for image analysis and quantification |
Blog post/video: Advancing lithium-ion battery technology with 3D imaging |
| App note: Multiscale image-based control and characterization of lithium-ion batteries | |||
Characterize beam-sensitive materials like SEI at nanoscale |
TEM, EDS, Avizo |
Nano- and atomic-scale characterization of energy materials · Cryo-EM workflow for accurate data collection with superior EDS performance · Avizo Software for structure quantification and visualization |
Brochure: Analytical solutions for battery and energy storage technology |
Characterize beam-sensitive separator samples without damage |
SEM/SDB |
Superior low-KeV imaging and a cryo-FIB milling solution allow characterization of separator microstructure in 2D and 3D |
App note: Strategies for accurate imaging on battery separator structure |
In situ kinetic analysis (like heating) via electron microscope |
SEM |
Multiple in situ heating stage choices with integrated software for Thermo Scientific SEMs to understand cathode synthesis mechanisms |
Brochure: Scanning electron microscopy for lithium battery research |
Probe intrinsic SEI within a coin cell via electron microscopy |
Laser plasma FIB |
High-energy, high-milling rate laser enables direct cross-section milling to understand Li-metal cell degradation mechanism |
|
Materials QC requires higher resolution than OM, but floor-based SEMs won’t fit in our lab and manual analysis is too slow |
Desktop SEM |
Compact Phenom XL Desktop SEM can handle high-resolution morphology analysis and QC of anode and cathode materials with high-throughput automation |
TBD |
Identification and quantification of metal impurities in materials is critical, but neither ICP nor optical microscopy does both |
Desktop SEM, EDS |
Thermo Scientific Phenom ParticleX Desktop SEM can identify and quantify particle impurities with high-throughput automated EDS workflow |
Webinar: How to certify your NCM powder quality with SEM+EDS |
Detection of electrode impurities is slow and tedious using normal SEM-to-EDS workflow |
ChemiSEM, EDS |
Thermo Scientific Axia ChemiSEM integrates SEM with “live EDS” for immediate characterization of electrode impurities |
App note: Assessment of contaminants within battery materials via Axia ChemiSEM |
Failure analysis and QC in battery production requires SEM-level resolution, but floor models take too much space |
Desktop SEM |
Compact Phenom Desktop SEMs enable high-resolution, high-throughput analysis of battery materials |
App note: Investigate batteries with a SEM for better performance |
Binder characterization is difficult but crucial to confirm electrode mechanical structure |
SEM, DualBeam |
Superior imaging contrast of unique T3 detector for Apreo 2 SEM enables mapping of non-conductive binder distribution within electrode |
Brochure: Scanning electron microscopy for lithium battery research |
Identification of impurities for root cause analysis is difficult using CT alone |
CT/SDB, EDS, Avizo |
A correlative CT/laser PFIB workflow can identify deeply embedded impurities without disassembling the cell |
App note: Multiscale 3D imaging solutions for Li-ion batteries |
Failure analysis requires high-resolution cross-section polishing while still protecting sample |
SEM, CleanMill |
CleanMill offers a dedicated workflow for air-sensitive samples, an ultra-high energy ion gun for fast polishing, and a cryogenic function to protect sample integrity |
Abbreviations: Avizo = Avizo Software; CT = Computed tomography; DualBeam = Focused ion beam scanning electron microscopy (FIB-SEM); EDS = Energy-dispersive X-ray spectroscopy; FIB = Focused ion beam; FTIR = Fourier transform infrared spectroscopy; ICP = Inductively coupled plasma; iDPC = Integrated differential phase contrast; IGST = Inert sample gas transfer; SDB = Small DualBeam; SEI = Solid electrolyte interface; SEM = Scanning electron microscopy; SPE = Solid polymer electrolytes; TEM = Transmission electron microscopy; TOF-SIMS = Time of flight secondary ion mass spectrometry.


For more electron microscopy images, see our Elemental Imaging (EDS) page.
High-resolution images of battery material with different detectors on an Apreo SEM. Clockwise from bottom left: in-column SE, ETD, in-column BSE, mixed signal.

Fast and easy imaging of battery components, even in a glovebox, on a Phenom Desktop SEM. Clockwise from bottom left: cathode particles, anode particles, ion milled electrode, separator.

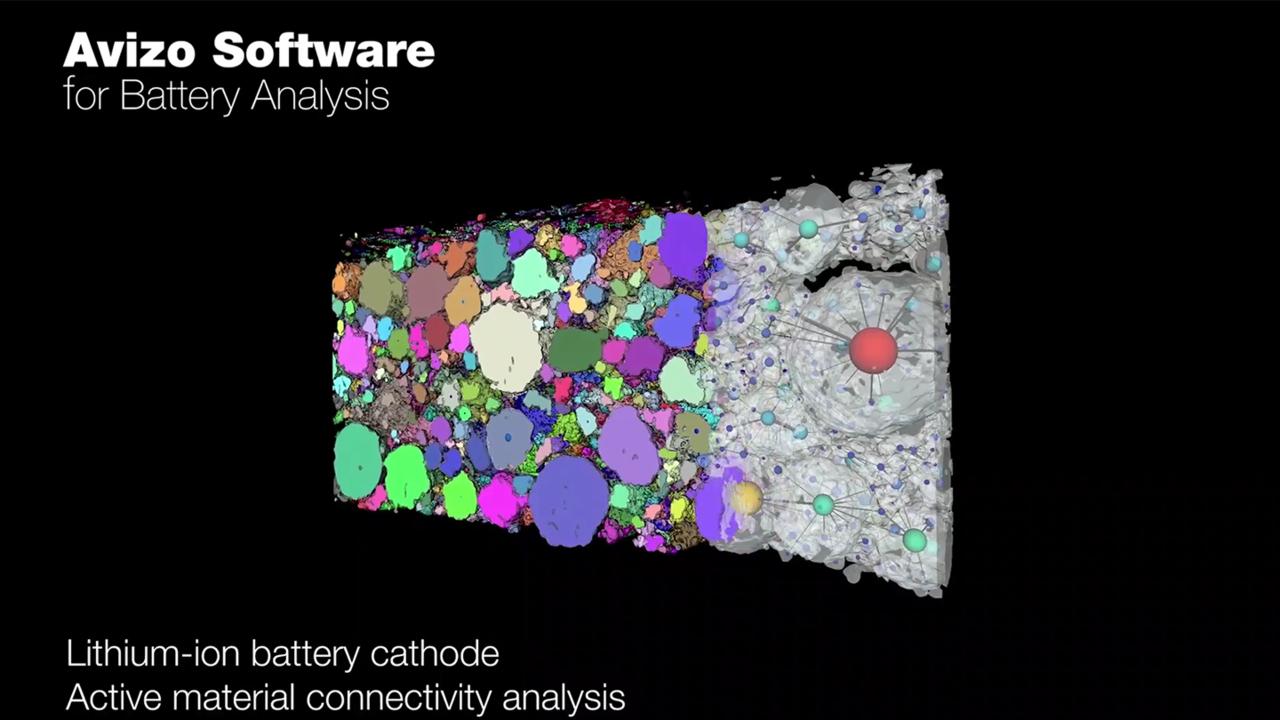
Connectivity of the active material in the conducting network plays a critical role in battery performance.
Model recreated from Helios DualBeam FIB-SEM data using Avizo Software.

NMC 811 cathode cross section.
Prepared on Helios 5 PFIB DualBeam and analyzed using Avizo2D Software to quantify structure parameters of NMC particles. Courtesy of Ron Kelley and Harold Phelippeau (Thermo Fisher Scientific) and Prof. Shirley Meng (University of Chicago).

SEM image of NMC cathode sample.
Captured on Apreo 2 SEM.

HR-TEM image of Li-metal crystal lattice.
Captured on Talos F200X TEM with XCFEG source. Courtesy of Lin Jiang, Thermo Fisher Scientific.

Li-metal S/TEM sample.
Captured in STEM on Talos F200X TEM. Courtesy of Lin Jiang, Thermo Fisher Scientific.

Li-metal S/TEM sample.
Captured on Helios 5 Hydra DualBeam under cryogenic conditions (–170°C). Courtesy of Brandon Van Leer, Thermo Fisher Scientific.

SEM image of lithium carbonate and nickel manganese cobalt hydroxide particles.
Captured on Apreo 2 SEM.

SEM image of LNMO cathode particles
Captured on Apreo 2 SEM. Courtesy of Ice Xiao (Thermo Fisher Scientific) and Dr. Weikang Li (University of California, San Diego).
SEM image of lithium battery separator sample.
Captured on Apreo 2 SEM.

Interface analysis of Li/In metal and sulfide-based solid electrolyte
Captured on Helios 5 Hydra DualBeam. Courtesy of Brandon van Leer (Thermo Fisher Scientific) and So-Yeon Ham (University of California, San Diego).
NMC 811 cathode particle cross-section analysis.
Captured on Helios 5 PFIB DualBeam with ICD detector. Courtesy of Letian Li (Thermo Fisher Scientific) and Prof. Shirley Meng (University of Chicago).

TEM lamella.
Prepared using AutoTEM 5 Software on Helios 5 Hydra DualBeam. Courtesy of Letian Li (Thermo Fisher Scientific).

Webinar: Characterization of batteries and energy materials: Avizo Software
In this introductory webinar, you will learn how to use Avizo Software workflows to repeatably visualize and analyze battery samples from 2D and 3D acquisition techniques. Identify and measure complex features in electrode materials and entire cells with high accuracy.
For Research Use Only. Not for use in diagnostic procedures.